Using the Groundwater Flow Module
The Groundwater Flow Module simulates groundwater flow velocity, which is magnitude- and direction-velocity, using a digital representation of the earth’s surface and soil porosity.
Data Inputs
Double-click the [1 Groundwater Flow] module, and the groundwater flow Python toolset opens in the [Geoprocessing Pane], as shown in Figure 10-1.
Take a moment to review the data inputs, outputs, and parameters. Please remember that data inputs and outputs marked with a red asterisk [*] are required for the geoprocessing operation.
Click the drop-down arrow next to [Parameters] to expose the options.
Data inputs:
Input the digital elevation model (DEM) surface elevation map [L] (raster).
Lakeshore Example input DEM raster: [lakeshore.img]
Input the water bodies (polygon).
Lakeshore Example input water body polygons: [water bodies.shp]
Input the hydraulic conductivity [L/T] (raster).
Lakeshore Example input raster: [hydr_cond.img]
Input the soil porosity (raster).
Lakeshore Example input raster: [porosity.img]
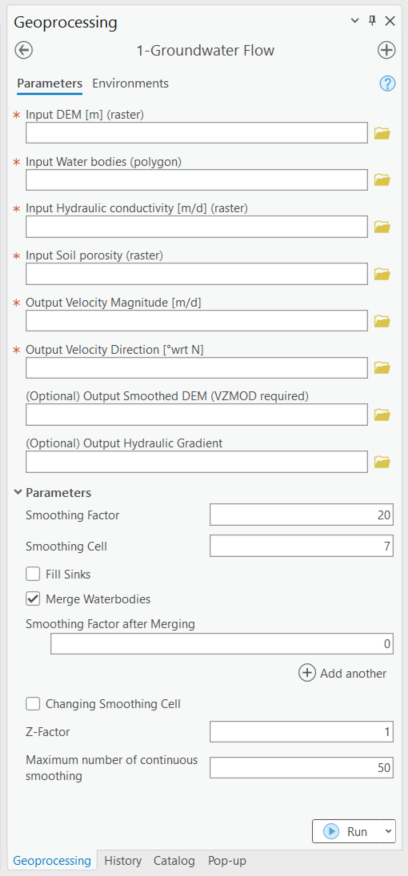
Figure 10-1: The Groundwater Flow Module in the Geoprocessing Pane.
There are several options for selecting data for a geoprocessing tool in ArcGIS Pro. If you are unfamiliar with ArcGIS Pro geoprocessing tools, please use the following URL to learn how to use geoprocessing tools. URL: https://pro.arcgis.com/en/pro-app/latest/help/analysis/geoprocessing/basics/run-geoprocessing-tools.htm
Use the [Map] (Figure 10-2), [Catalog View], [Catalog Pane], or [Folder Icon] to select the necessary data inputs.
If you have the data from the Lakeshore example in a [Map] in your ArcGIS Pro Project file and the [Geoprocessing Pane] open, you can drag and drop the necessary inputs or select the files from the drop-down menu for each of the input fields.
The input raster images are automatically styled with a black-and-white contrast stretch. ArcGIS Pro assigns two stretch types based on whether your raster dataset has one value or many values. The stretch type [Standard Deviation] is for raster datasets with many values, and the stretch type [None] is for datasets with only one value.
Please note that the symbology for the Lakeshore Example data inputs and outputs have been changed from the ArcGIS Pro automatic default symbology for aesthetic purposes.
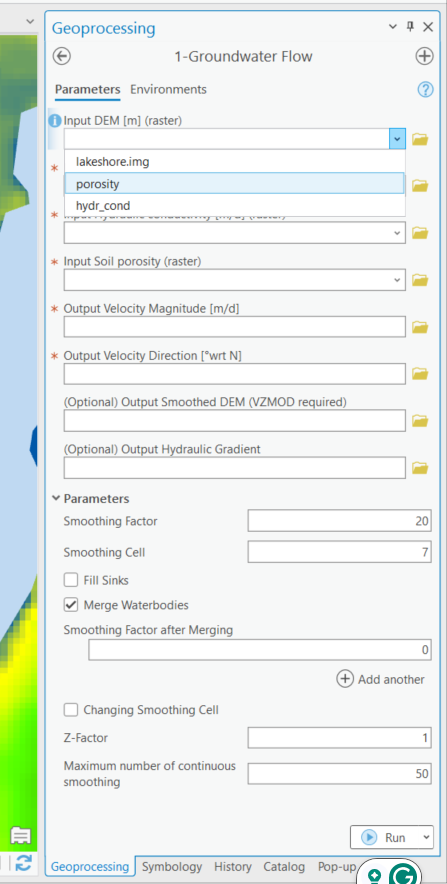
Figure 10-2: Selecting Groundwater Flow Module inputs in the Map View.
If you have the data from the lakeshore example open in a [Catalog Pane] or [Catalog View] (Figure 10-3) and the [Geoprocessing Pane] open, then you can drag and drop the necessary inputs.
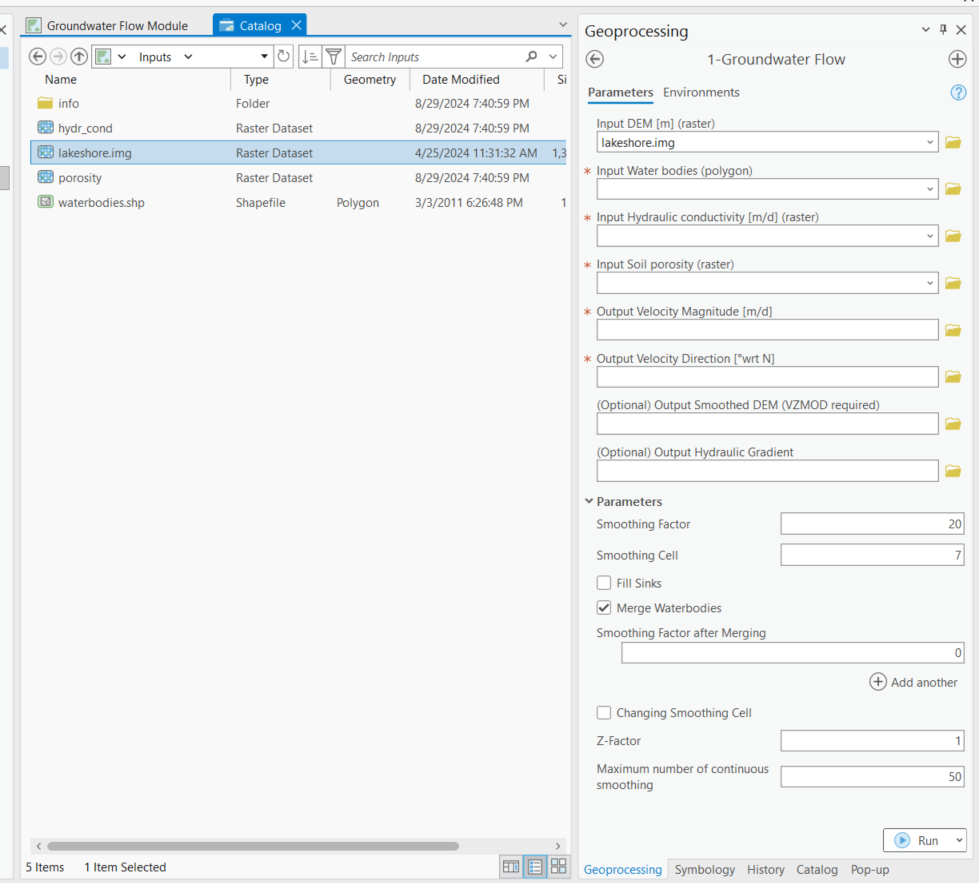
Figure 10-3: Selecting Groundwater Flow Module inputs by dragging and dropping from the Catalog View.
You can also click the [Folder Icon] next to each field to select the data inputs using the Windows File Explorer. To use this method, you must use the Windows File Explorer to navigate to the […\2_lakeshore_example_phosphorus\1_Groundwater_flow_module\Inputs] folder to select each data input and click [OK], as shown in Figure 10-4
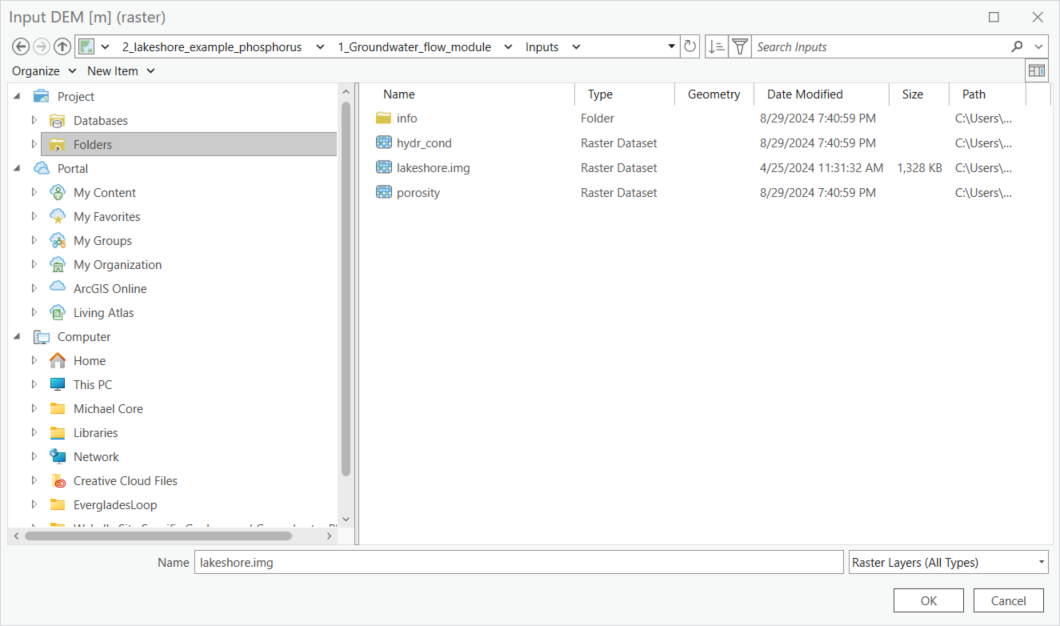
Figure 10-4: Selecting Groundwater Flow Module inputs from the Windows File Explorer.
Data Outputs and Parameters
Storing your files in an organized and appropriately named manner is good practice when selecting locations for data outputs. For this exercise, use the [Windows File Explorer] or ArcGIS Pro [Catalog Pane] to create a new folder titled [LakeshoreExampleOutputs_YYYY_MM_DD] to store the raster images and vector shapefiles. For this example, the folder name is [Outputs].
To create a new file folder in ArcGIS Pro, use the [Catalog Pane], right-click on the folder […\2_lakeshore_example_phosphorus\1_Groundwater_flow_module\Outputs], hover over the option [New] in the submenu, and click [Folder] (Figure 10-5).
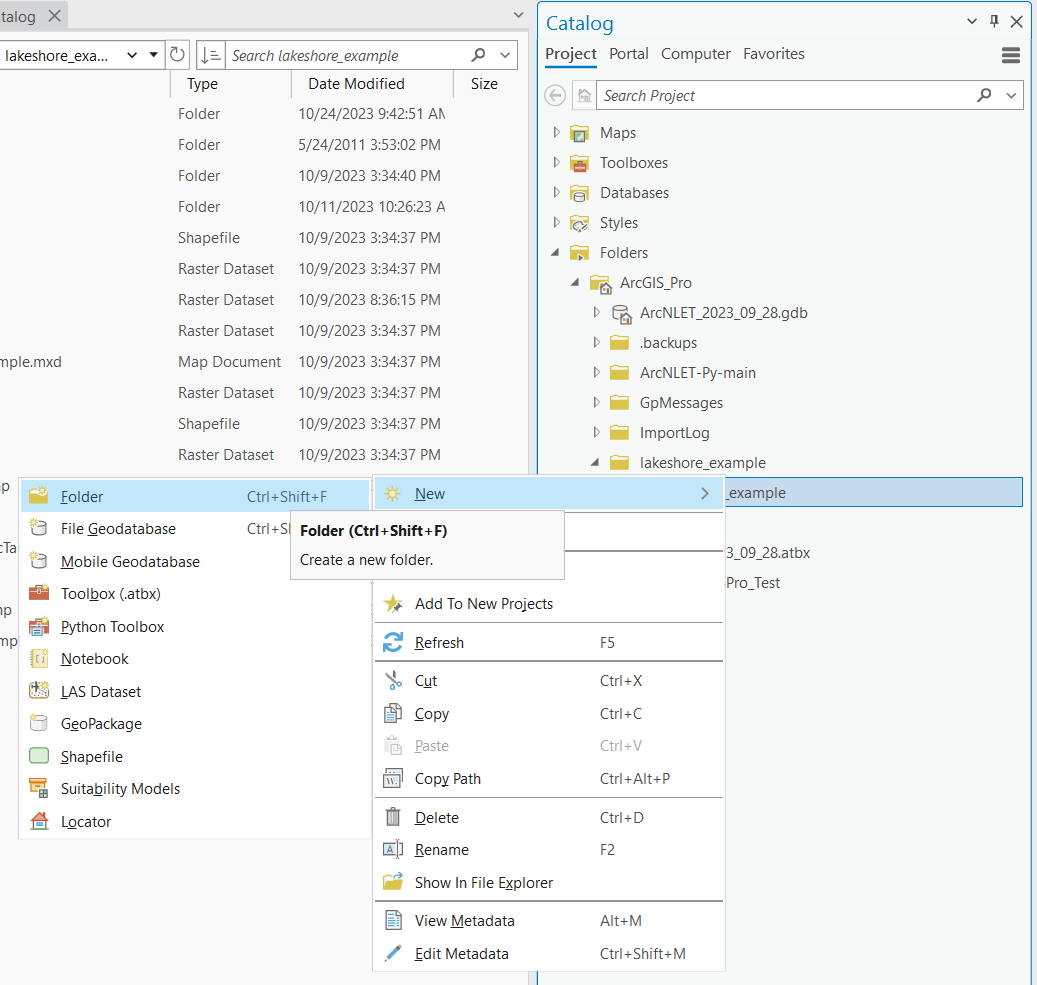
Figure 10-5: Creating a new file folder in the ArcGIS Pro Catalog Pane.
Select the necessary data outputs by clicking the [Folder Icon] next to each field in the [Geoprocessing Pane] for each data output.
The Windows File Explorer opens, and in the left pane under [Project], click the drop-down arrows to expand the [Folders] and [ArcGIS Pro] home folder.
Select the […\2_lakeshore_example_phosphorus\1_Groundwater_flow_module\Outputs] folders.
Click the output folder, created in step 2 above, to store the output raster images from the Groundwater Flow Module.
The file path and name for the [Output Velocity Magnitude [L/T] (raster)] for this example is: […\2_lakeshore_example_phosphorus\1_Groundwater_flow_module\Outputs\velmag50]
Type the name of the raster data output into the [Name] field with no file extension and click [OK].
The ArcNLET-Py ArcGIS Pro Python toolset automatically assigns the correct file types, and if you enter a file type, a warning is triggered.
Then, move to the subsequent output raster in the [Geoprocessing Pane].
Please note that you must use the [Folder Icon] to select the output folder location and the Windows File Explorer to name each output.
Data outputs:
Output Velocity Magnitude [m/d]
Lakeshore Example output raster: [velmag50]
Output Velocity Direction [°wrt N]
Lakeshore Example output raster: [veldir50]
Optional Output Hydraulic Gradient
Lakeshore Example output raster: [grad50]
Optional Output Smoothed DEM (required for VZMOD)
Lakeshore Example output raster: [smth50]
Please note that when typing the data outputs into the provided field in the [Geoprocessing Pane], the outputs are automatically stored in the folder with the [Input DEM surface elevation map [L] (raster)] or the home default folder of the ArcGIS Pro Project file.
Input DEM [m] (Raster)
Input raster file: [lakeshore.img]
Input Water Bodies (Polygon)
Input shapefile: [waterbodies.shp]
Input Hydraulic Conductivity [m/d] (Raster)
Input raster file: [hydr_cond]
Input Soil Porosity (Raster)
Input raster file: [porosity]
Parameters related to model validation and verification for the Lakeshore Example:
Smoothing Factor
Value: [50]
Please note that when calibrating ArcNLET-Py, you may label the Groundwater Flow Module outputs with the smoothing factor number after the file name to track changes in your groundwater shape. For example, the output velocity magnitude and velocity direction can be labeled [velmag50] and [veldir50].
Smoothing Cell
Default value: [7]
Fill Sinks
Value: [1]
Merge Water Bodies
Value: [50]
Z-Factor
Default value: [1]
Maximum Number of Continuous Smoothing
Default value: [50]
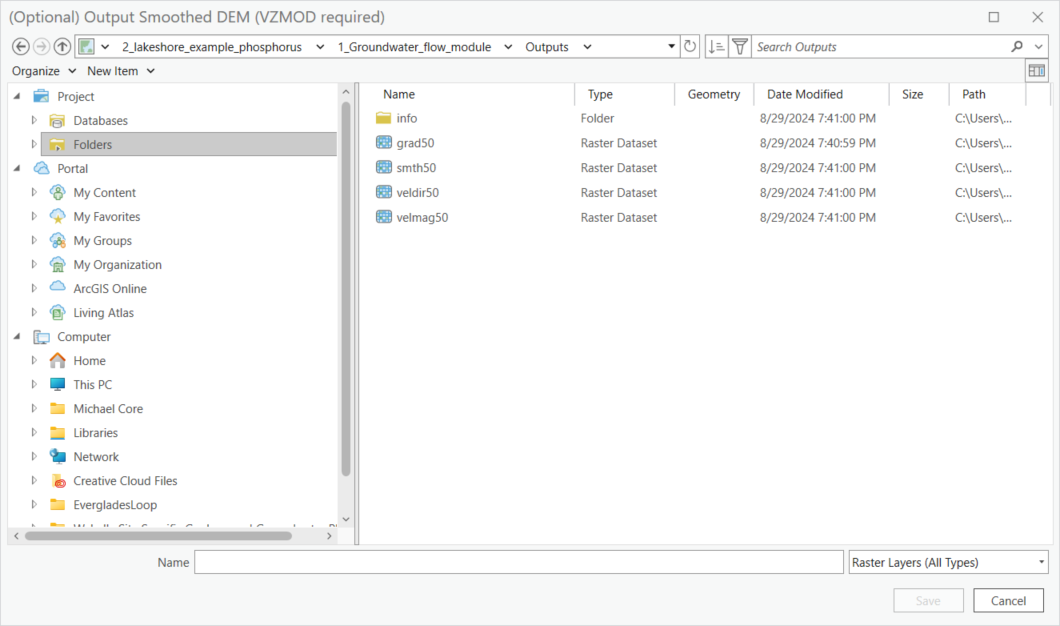
Figure 10-6: Selecting the data output location from the Windows File Explorer for the Groundwater Flow Module.
Double-check to ensure all red astricts [*] are removed from the [Geoprocessing Pane], indicating that all necessary data inputs and outputs have the correct file type and are accessible.
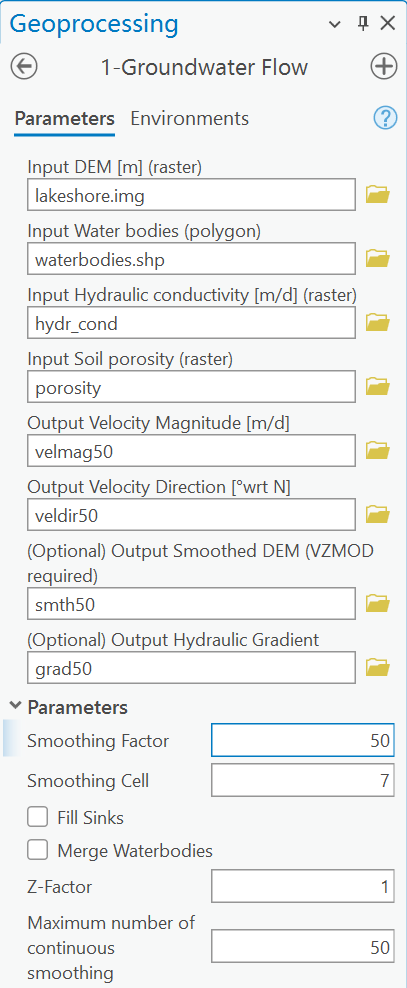
Figure 10-7: The Groundwater Flow Module data inputs and outputs in the Geoprocessing Pane.
Executing the Module
Once satisfied with the data input and output selections, click [Run] in the [Geoprocessing Pane].
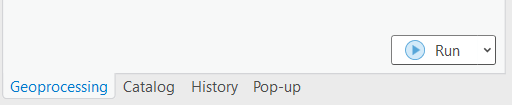
Figure 10-8: The Run button in the Geoprocessing Pane.
The ArcNLET-Py Groundwater Flow Module begins to process data, and the progress bar appears. The runtime can vary depending on the data sets’ file sizes, spatial scale, and raster cell size.
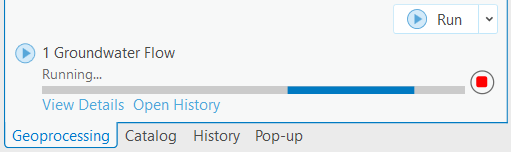
Figure 10-9: The progress bar in the ArcGIS Pro Geoprocessing Pane for the Groundwater Flow Module.
ArcGIS Pro indicates the tool is finished with a green notification box at the bottom of the [Geoprocessing Pane]. You may click [View Details] for more information about the process, including data inputs and outputs, start and end times and dates, and a success or failure message.
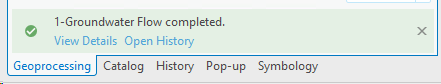
Figure 10-10: The green notification box in the ArcGIS Pro Geoprocessing Pane for the Groundwater Flow Module.
View and Verify Results
If you have your data inputs in an open [Map] in ArcGIS Pro, the data outputs are automatically added to the [Contents Pane] and the [Map] view. Alternatively, if you do not have your input data in a [Map], nor do you have a [Map View] open in your ArcGIS Pro Project, and you run the ArcNLET-Py Groundwater Flow Module from the [Geoprocessing Pane]. Your results are accessible via the [Catalog Pane] or [Catalog View] in the output folder.
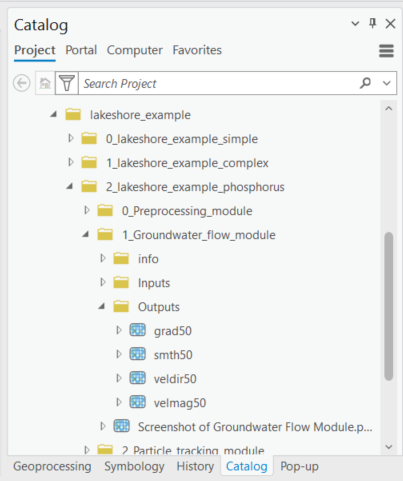
Figure 10-11: The ArcNLET-Py Groundwater Flow Module outputs in the Catalog Pane.
Take a moment to review each output to ensure your data has been processed correctly. Your data must be processed correctly because data outputs from the groundwater flow are used as data inputs in the subsequent modules.
The output raster images are automatically styled with a black-and-white contrast stretch. ArcGIS Pro assigns two stretch types based on whether your raster dataset has one value or many values. The stretch type [Standard Deviation] is for raster datasets with many values, and the stretch type [None] is for datasets with only one value.
Please note that the symbology has been changed from the ArcGIS Pro automatic default symbology for aesthetic purposes.
If your raster image outputs have a solid black fill with only null or no-data values, then this is an indicator that there might have been an error processing the data inputs. Please ensure all your data inputs are correct, in an accessible file folder, and are uncorrupted.
If you continue having issues processing your data, please [View Details] as previosuly mentioned to see if empty datasets were created as outputs. Empty datasets indicate an issue with the input data, an error in the file names, or ArcGIS Pro not having read/write access to input or output file locations.
If you cannot find a solution to the issue, then please submit a [New issue] in the ArcNLET-Py GitHub repository (Issues · ArcNLET-Py/ArcNLET-Py · GitHub) as described in the GitHub instructions at Creating an issue - GitHub Docs.
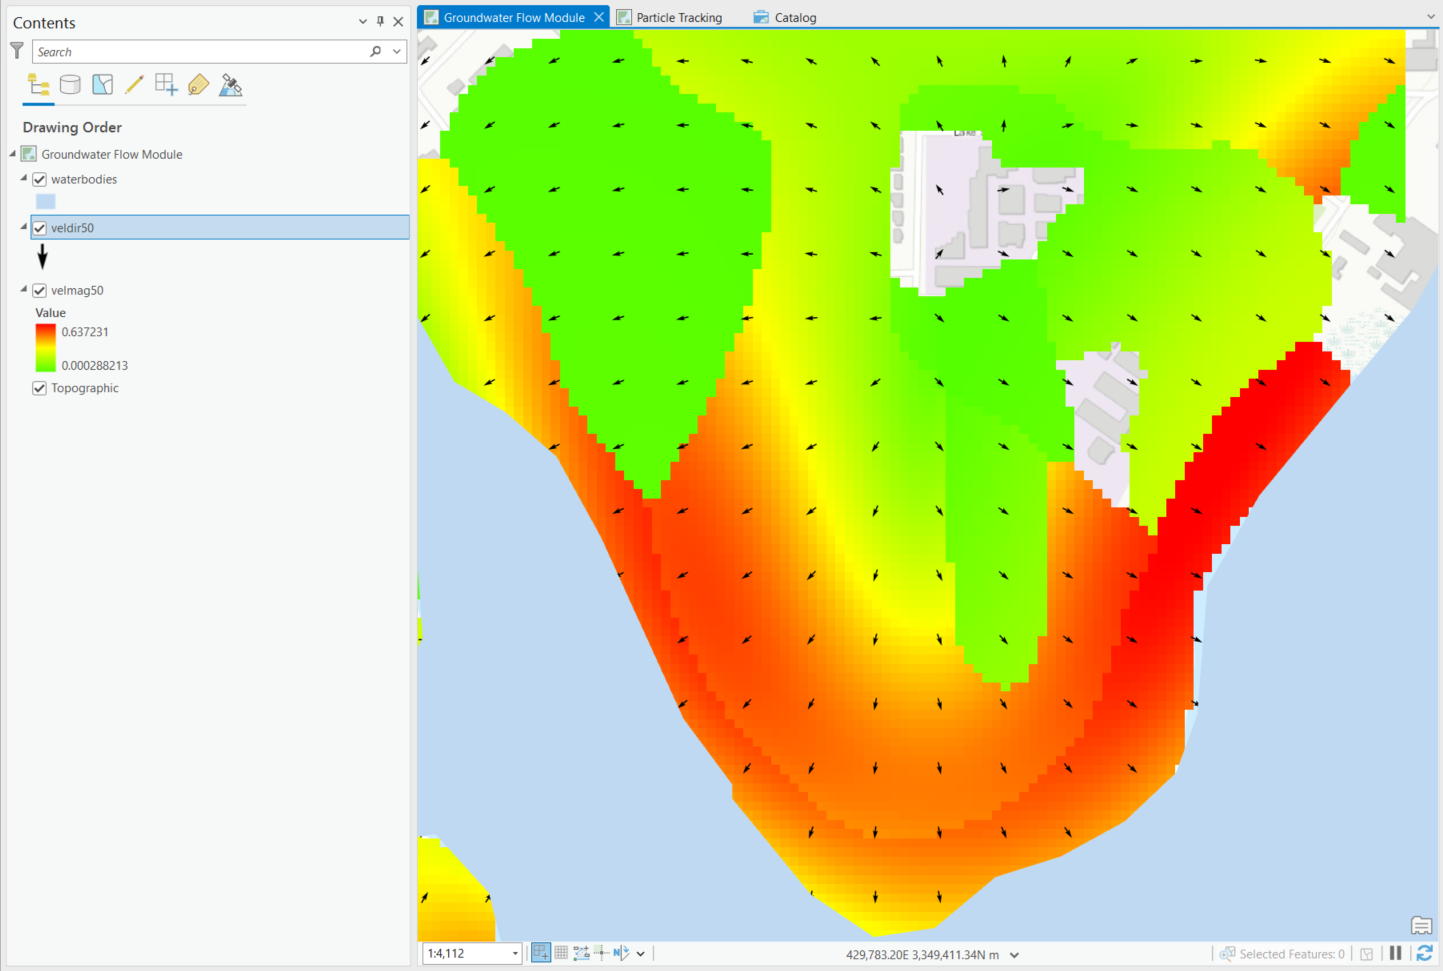
Figure 10-12: The Particle Tracking Module data inputs and output in the Geoprocessing Pane.
The velocity is shown with black arrows and the magnitude ranges from lows in green to highs in red.