3-VZMOD
The Vadose Zone MODel (VZMOD) is a tool that simulates the transformation and one-dimensional (1-D) vertical transport of NH4, NO3, and PO43- in the vadose zone beneath the drain field of an OSTDS. Since this module aims to simulate long-term, vertical migration of OSTDS effluent from a drainfield in the Soil Treatment Unit (STU) to groundwater, the vadose zone flow and nutrient transport are assumed to be in a steady state. VZMOD simulates the adsorption and nitrification processes of ammonium (NH4+), the denitrification process of nitrate (NO3-), and the adsorption processes affecting phosphate (PO43-) occurring in the vadose zone. For each septic system, VZMOD produces vertical profiles of NH4, NO3, and PO43- concentrations in the vadose zone and estimates the concentrations of NH4+, NO3-, and PO43- at the water table. Similar to other modules of ArcNLET-Py, the conceptual model of VZMOD simplifies nutrient fate and transport, reduces the modeling data requirement, and efficiently manages data and pre- and post-processing.
Running VZMOD is optional for ArcNLET-Py, and it is only needed when nutrient transport in the vadose zone is of interest to the users, i.e., when spatially distributed ammonium, nitrate, and phosphate concentrations at the water table are needed. Alternatively, the module can stand alone without the aid of the rest of the ArcNLET-Py toolbox to simulate nutrient transformation and transport from an OSTDS in various soil types. When used with the entire ArcNLET-Py toolset, VZMOD can simulate nutrient transformation and 1-D transport from multiple septic systems in the vadose zone with heterogeneous soil hydraulic parameters. The module reads input hydraulic conductivity and soil porosity raster layers to assign heterogeneous parameters for individual OSTDS. Figure 3-1 shows the flow chart for VZMOD. The first step is to read the flow, nutrient transformation, and transport parameters for a given soil type. Using VZMOD for a Single OSTDS, these parameters solve the flow and nutrient transport equations sequentially, and the concentration profiles are saved for post-processing.
Note
There are three options for the Types of Contaminants available in VZMOD: Nitrogen, Phosphorus, and Nitrogen and Phosphorus. Please refer to Figures 3-4, 3-5, and 3-6 for visual clarification on these options.
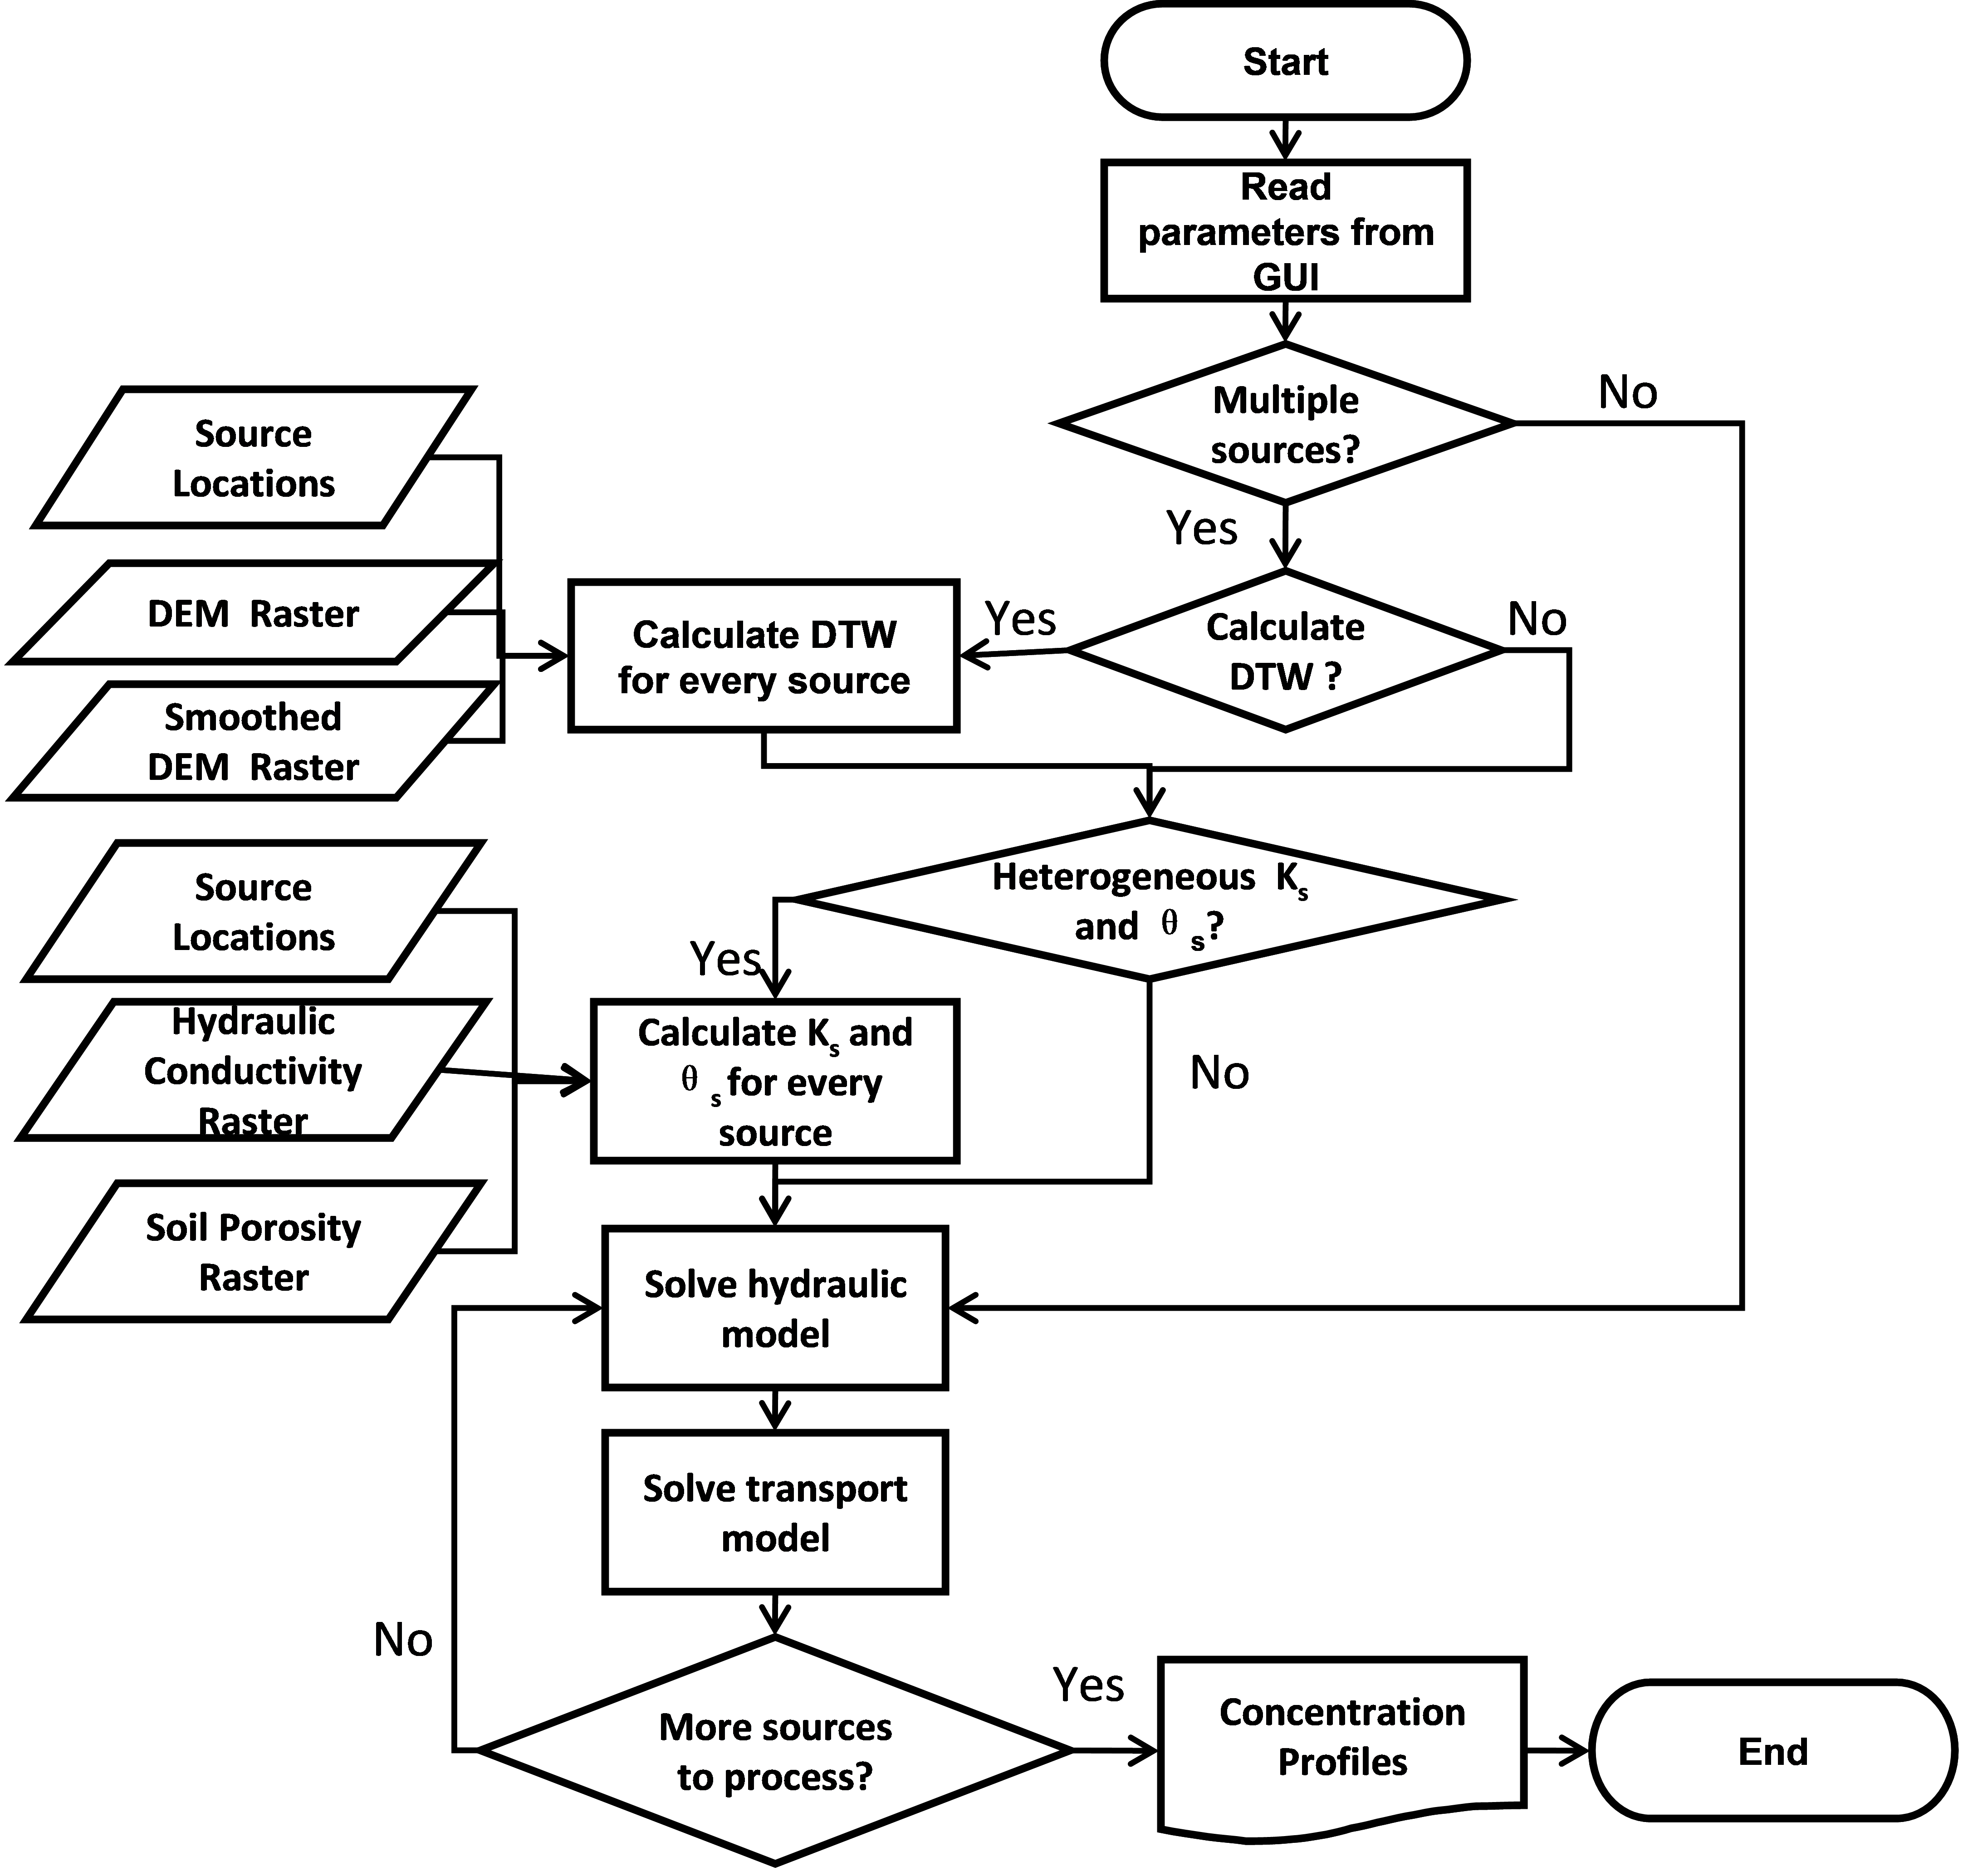
Figure 3-1: Flowchart for VZMOD.
VZMOD can also be used for Multiple OSTDS at a neighborhood scale. In that case, Heterogeneous Ks and θs, Calculate depth to water table, and Multiple soil types are selected. Then, data are needed to consider the spatial variability of Septic tank sources (point), Hydraulic conductivity (raster), and Soil porosity (raster). As shown in Figure 3-2, three datasets representing Septic tank sources (point), DEM file (raster), and Smoothed DEM (raster) are used to Calculate DTW, where DTW stands for Depth To Water table. The next step is determining whether homogeneous or heterogeneous hydraulic conductivity (Ks) and porosity (θs) are used. The homogeneous parameter values are those read from the VZMOD Geoprocessing Pane when VZMOD is used for a Single OSTDS. The heterogeneous data are extracted from the Hydraulic conductivity (raster) and Soil porosity (raster) to the Septic tank source (point) locations. After this, VZMOD solves the flow and transport models for each OSTDS, simulating the movement and transformation of NH4, NO3, and PO43- in the vadose zone and estimating their concentrations at the water table.
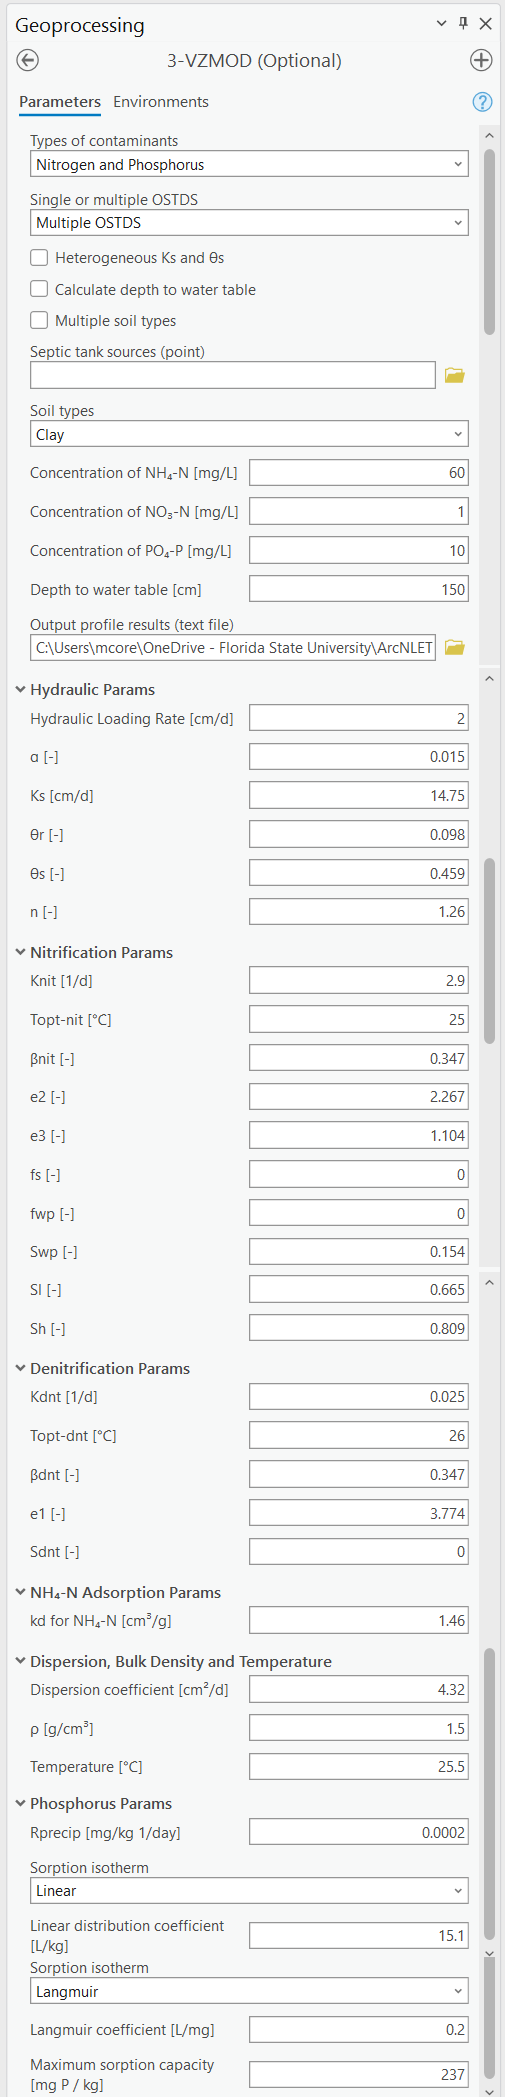
Figure 3-2: The VZMOD Module in the Geoprocessing Pane.
The VZMOD Geoprocessing Pane (Figure 3-2) has two segments for model inputs. The first is the input files that address the spatial variability of hydraulic conductivity, soil porosity, soil types, and the DTW. The second is for inputting the model parameters. The list of the input parameters of VZMOD, their units required for the simulation, and descriptions of the parameters are described below. Based on an extensive literature review, McCray et al. (2005, 2010) provided the spreadsheet-based analytical flow and transport model (STUMOD) with default values for hydraulic, temperature, nitrification, effluent, denitrification, and adsorption parameters. The default values are used in VZMOD, except that the values of the first-order reaction rate of nitrification (Knit) and denitrification (Kdnt) are from McCray et al. (2005). In addition, the values of dispersion coefficient (D), temperature (T), and depth to water table (DTW) are determined by the users since they are site-specific. Users should specify appropriate D, T, and DTW values for the site(s). The hydraulic parameters, the coefficient, e1, of the saturation function of denitrification, and the coefficient, kd, of adsorption are specific to soil types, and other parameters are the same for different soil types. Note that the default parameters are provided as a reference, and users of VZMOD are responsible for determining appropriate values for their own nutrient modeling.
The desired functionality of VZMOD dictates the input files. This process is automated in VZMOD. When VZMOD is used for modeling multiple septic systems, the user must select Multiple OSTDS from the Single or multiple OSTDS from the drop-down menu. This selection activates the options for Heterogeneous Ks and θs, Calculate depth to water table, Multiple soil types, and reveals the drop-down menu for the Septic tank source (point). The user can use Heterogeneous Ks and θs and Calculate depth to water table separately or jointly. Likewise, when selecting Multiple soil types, the drop-down for the input Soil types (raster) is available, and the hydraulic parameters are reduced to the Hydraulic Loading Rate (cm/d).
Alternatively, when selecting Heterogeneous Ks and θs, the options for inputting the Hydraulic conductivity (raster) and Soil porosity (raster) become active for the user. The options allow for the input raster layers of heterogeneous saturated hydraulic conductivity and soil porosity (approximately equal to the saturated water content). The files are also Groundwater Flow Module input data and can be generated using the Preprocessing Module or data from SSURGO.
VZMOD now supports modeling for different types of contaminants, including Nitrogen, Phosphorus, and Nitrogen and Phosphorus. When phosphorus is selected, additional parameters become available, such as the Rprecip parameter, which refers to the precipitation rate of phosphate. For phosphorus sorption isotherms, two options are available:
Linear: This method includes only the Linear distribution coefficient parameter.
Langmuir: This method includes the Langmuir coefficient and maximum sorption capacity parameters.
These options provide flexibility in simulating phosphorus adsorption and transport processes in different soil conditions, enabling more accurate predictions of phosphorus fate in the vadose zone. The reference for these parameters is McCray et al. (2005).
When selecting Calculate depth to water table, the user must input the DEM file (raster) and the Smoothed DEM (raster). This function calculates the depth from the infiltrative surface to the water table for each OSTDS drainfield. The DEM raster file is the input of the Groundwater Flow Module and generates an approximation shape of the water table by assuming that the water table is a subdued replica of topography. The smoothed DEM is the optional output raster file from the Groundwater Flow Module and is assumed to have a similar shape as the groundwater table. In other words, the smoothed DEM is assumed to be parallel to the water table. Based on this assumption and using the two files, the distance from the infiltrative surface to the water table (DTW) for individual septic systems can be calculated in the following procedure:
Calculate the elevation of the water table by subtracting a constant (denoted as A) from the smoothed DEM, i.e., (Smoothed DEM – A). This constant is the distance between the smoothed DEM and the water table. It can be estimated from field measurements of water level in monitoring wells. This estimation requires first calibrating the smoothing factor of ArcNLET in the manner of Wang et al. (2011). After the calibration, a plot is created based on the measured water level and smoothed DEM, as shown in Figure 3-3, which is adapted from Wang et al. (2011). By fitting a linear regression curve between the measured water level and smoothed DEM, the intercept of the linear curve is the value of A. In Figure 3-3, the A value is 2.86m.
Calculate the elevation of the infiltrative surface by subtracting the distance of the infiltrative surface to the land surface (denoted as B) from the thickness of the vadose zone, i.e., (DEM – B). The recommended depth for B is 18 inches because the drainfield is about 12 inches thick (for gravel) and is covered by 6 inches of soil (USEPA, 2002).
The DTW from the infiltrative surface to the water table is calculated via:
(DEM – B) – (Smoothed DEM – A) = DEM – Smoothed DEM + (A – B). The user must input the value of A – B ([cm]) via the Distance (cm) field shown in Figure 3-2.
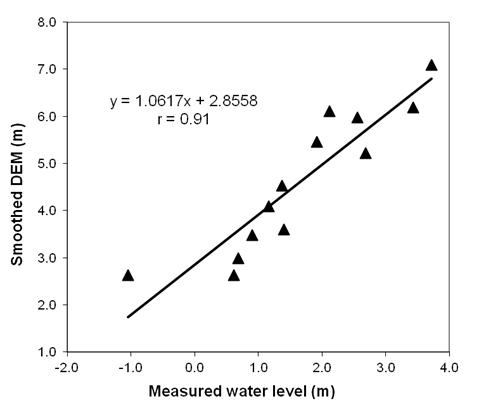
Figure 3-3: Linear regression curve between the measured water level and the smoothed DEM.
The plot shows the relationship between the measured and simulated water table for the Julington Creek Neighborhood.
Input Layers
The input requirements for VZMOD are described in detail below. The sections are organized by the functionality of the module due to VZMOD’s many combinations of functionalities. The first step is to choose the Types of Contaminants, which includes options for Nitrogen, Phosphorus, or Nitrogen and Phosphorus. This selection influences the additional parameters and input options that will be revealed, such as those related to nitrification, denitrification, adsorption, and phosphorus sorption isotherms.
After selecting the contaminant type, the user can choose to model either a Single OSTDS or Multiple OSTDS. When Multiple OSTDS is selected, there are additional options (i.e., Heterogeneous Ks and θs, Calculate depth to water table, and Multiple soil types) revealed that have separate data requirements (e.g., Septic tank sources (point), Hydraulic conductivity (raster), and Soil porosity (raster)). The user may choose to use these options and data separately or in combination based on the available data and the specific needs of the study area. For example, you may only be interested in analyzing Multiple OSTDS with Heterogeneous Ks and θs that have Multiple soil types in the study area. VZMOD provides the flexibility to pick and choose the aspects that are relevant to your modeling objectives. The workflows and data requirements for each VZMOD deployment are detailed separately below. Remember that you must decide which combination of inputs and options works best for you.
Types of Contaminants
Selecting the contaminant type is the first step in setting up a VZMOD model. Each option reveals different parameter inputs:
Nitrogen: This option (Figure 3-4) enables parameters related to ammonium (NH4+) and nitrate (NO3-) transformation and transport, including nitrification and denitrification processes.
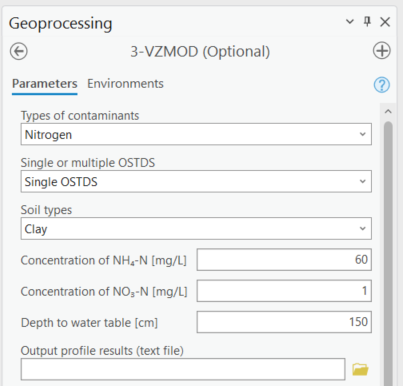
Figure 3-4: Nitrogen in VZMOD.
Phosphorus: Selecting phosphorus (Figure 3-5) will activate phosphorus-specific parameters, including sorption isotherm options such as Linear (with parameters for Rprecip and Linear distribution coefficient) and Langmuir (with parameters for Rprecip, Langmuir coefficient, and maximum sorption capacity).
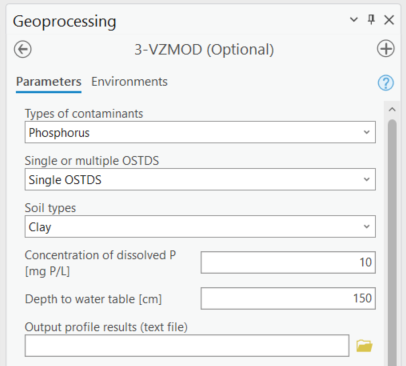
Figure 3-5: Phosphorous in VZMOD.
Nitrogen and Phosphorus: This option, shown in Figure 3-6 includes both nitrogen and phosphorus parameters, combining nitrification, denitrification, and phosphorus adsorption processes for comprehensive nutrient modeling.
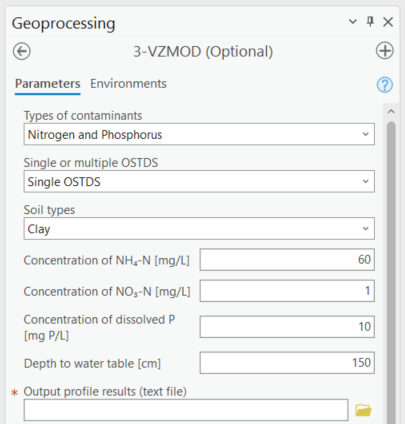
Figure 3-6: Nitrogen and phosphorus in VZMOD.
Single OSTDS
Analyzing a Single OSTDS utilizing VZMOD (Figure 3-7) is the most straightforward process, only requiring the user to select the Soil types from the dropdown menu, the Output folder, and to use the default or update the Hydraulic Params, Nitrification Params¸ Denitrification Params, Adsorption Params, and Temperature and Transport Params values, which are shown in Figure 3-2.
Soil types: When Single OSTDS is selected, the soil type is one of the USDA soil types.
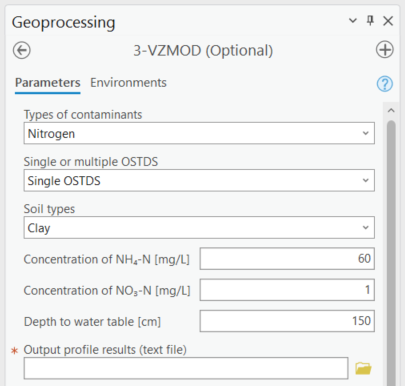
Figure 3-7: VZMOD for a single OSTDS.
The Figure shows the selection for using only the Single OSTDS option in VZMOD.
Multiple OSTDS
Modeling Multiple OSTDS (Figure 3-8) requires more data inputs than a Single OSTDS. Selecting Multiple OSTDS reveals the options to use data inputs for Heterogeneous Ks and θs, Calculate depth to water table, and Multiple soil types. As the user selects each additional option, fields are revealed for additional data inputs. The various options and their data inputs are described below. Please keep in mind that if you choose to model Multiple OSTDS, the data input requirements increase as you choose additional options (i.e., if you want to increase the potential of VZMOD modeling for your study area, then you need a better understanding of the soil porosity, soil moisture, topology, and/or the depth to the water table in the field for the study area than modeling a Single OSTDS). The data inputs are described below.
Septic tank sources (point): A point feature layer specifying the OSTDS locations. Note that this is the same input as the Particle Tracking Module.
Soil types: When Multiple OSTDS, the soil type is one of the USDA soil types.
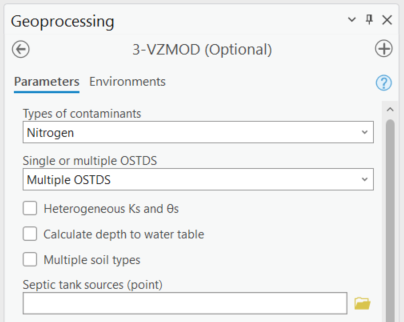
Figure 3-8: Modeling multiple OSTDS in VZMOD.
Multiple OSTDS with Heterogeneous Ks and θs
Heterogeneous Ks and θs: The heterogeneous Ks and θs option is shown in Figure 3-9. If checked, the parameters Ks and θs in the block of Hydraulic Params are disabled, and the two boxes for the Hydraulic conductivity (raster) and the Soil porosity (raster) are activated. The boxes input the module’s raster layers of heterogeneous saturated hydraulic conductivity and soil porosity. The data inputs are described below.
Septic tank sources (point): A point feature layer specifying the OSTDS locations. Note that this is the same input as the Particle Tracking Module.
Hydraulic conductivity (raster): This is the same input as the Groundwater Flow Module. This must be a raster layer with the units of meters per day. This input represents a map of hydraulic conductivity for the domain. The linear units of the hydraulic conductivity must be the same as the units of the DEM. For example, if the DEM has linear (ground distance) units of meters, the hydraulic conductivity must have units of meters per unit of time. The output seepage velocity magnitude has the same units as the input. It is the user’s responsibility to ensure that all units are consistent.
Soil porosity (raster): This is the same input as the Groundwater Flow Module. The soil porosity must be a raster layer. This input represents a map of soil porosity for the domain. This layer is a derivative of the processing module based on SSURGO.
Soil types: When Multiple OSTDS and Heterogeneous Ks and θs are selected, then the soil type is one of the USDA soil types.
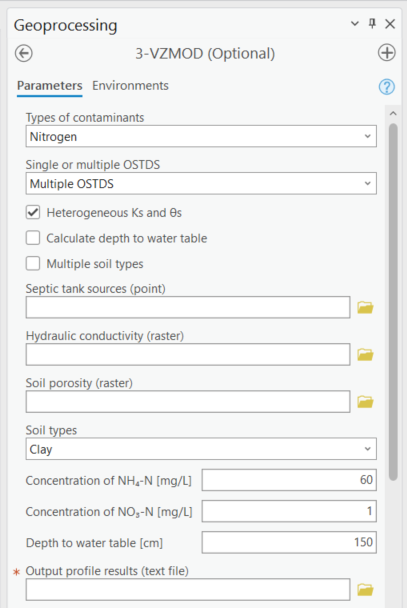
Figure 3-9: Modeling multiple OSTDS and heterogeneous Ks and θs in VZMOD.
Multiple OSTDS with Calculate Depth to Water Table
Calculate depth to water table: This option (Figure 3-10) allows users to input two raster images by selecting the DEM (raster) and the Smoothed DEM (raster). This function calculates the depth from the infiltrative surface to the water table for each OSTDS. The DEM raster is the same as the input from the Groundwater Flow Module. The Smoothed DEM (raster) is the optional output raster after smoothing the topography (DEM), which is assumed to have the shape of the groundwater table. The parameter Depth to water table (cm) changes to Distance (cm), which is the value of A – B discussed above. The Distance is the length from the infiltrative surface to the water table, which needs to be calibrated. The data inputs are described below.
Septic tank sources (point): A point feature layer specifying the OSTDS locations. Note that this is the same input as the Particle Tracking Module.
DEM file (raster): This is the same input as the Groundwater Flow Module. The DEM is used to generate an approximation of the water table. This input must be a raster layer (preferably in GRID format) with the units of meters. Note that a higher resolution DEM does not necessarily give better results since a coarser DEM may better approximate the water table (Wolock and Price, 1994).
Smoothed DEM (raster): The smoothed DEM is an optional output of the Groundwater Flow Module and should be in the units of meters. The smoothed DEM represents the subdued replica of the topology provided by the input DEM. This DEM represents the shape of the groundwater and does not represent the elevation of the groundwater.
Soil types: When Multiple OSTDS and Calculate depth to water table are selected, then the soil type is one of the USDA soil types.
Distance (cm): The distance is the value of A – B discussed above. The Distance is the length from the infiltrative surface to the water table, which needs to be calibrated.
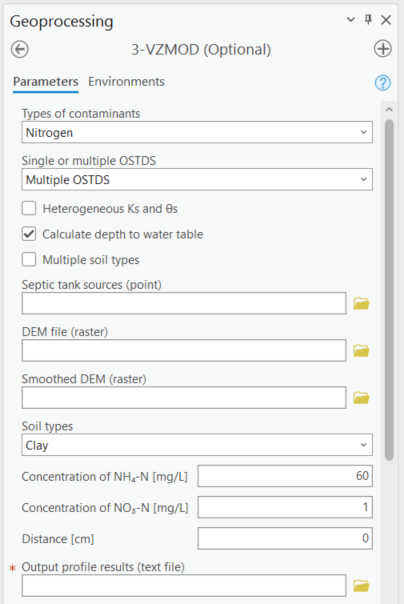
Figure 3-10: Modeling multiple OSTDS and calculating the depth to the water table in VZMOD.
Multiple OSTDS with Multiple Soil Types
Multiple soil types: Modeling multiple soil types is shown in Figure 3-11. If selected, the parameters α, Ks, θr, θs, n, e1, and kd are disabled, and the Soil types (raster) option is active. The data input requirements are below.
Septic tank sources (point): A point feature layer specifying the OSTDS locations. Note that this is the same input as the Particle Tracking Module.
Soil types: When Multiple OSTDS and Multiple Soil types are selected, the soil type file prepared using the pre-processing module is used here.
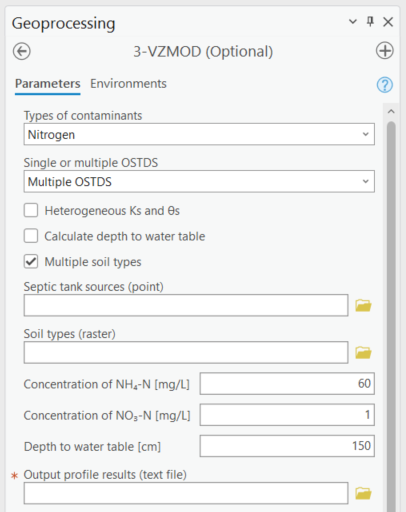
Figure 3-11: Modeling Multiple OSTDS and Multiple soil types in VZMOD.
Options and Parameters
Options
Types of Contaminants: This option allows the user to select either Nitrogen, Phosphorous, or Nitrogen and Phosphorous.
Single or Multiple OSTDS: This option allows the user to calculate a Single OSTDS or Multiple OSTDS. Multiple OSTDS need to be input using a shapefile.
Soil types: When Single OSTDS is selected, the soil type is one of the USDA soil types. When Multiple OSTDS and Multiple Soil types are selected, the soil type file prepared using the pre-processing module is used here.
Concentration of NH4 (mg/L): This value represents the OSTDS effluent concentration of ammonium. This information is gathered from trusted reports or ground-truthing effluent concentration via a monitoring well.
Concentration of NO3 (mg/L): This value represents the OSTDS effluent concentration of nitrate. This information is gathered from trusted reports or ground-truthing effluent concentration via a monitoring well.
Concentration of (PO43-) (mg/L): This value represents the OSTDS effluent concentration of phosphate. This information is gathered from trusted reports or ground-truthing effluent concentration via a monitoring well.
Distance (cm): This parameter is available for estimating a Single OSTDS or Multiple OSTDS. The distacne variable represents the depth from the infiltrative surface to the water table. Please note that this variable changes to Distance (cm) when using the Calculate depth to water table option.
Hydraulic Parameters
Hydraulic Loading Rate (cm/d): The hydraulic loading rate represents the average daily volume of effluent discharged for an OSTDS during a specified period.
If “multiple OSTDS” is selected, and the OSTDS location shapefile contains a column named “hlr” (case-insensitive),this input field will automatically be hidden. The program will then use the spatially distributed hlr values from the shapefile for calculation.
Each OSTDS’s hlr value will be constrained within the range O to Ks. Any values below 0.0 or above Ks will be automatically adjusted to 0 or Ks, respectively.
The a single hlr value is the default and recommended approach, unless site-specific hlr values for each OSTDS are available.
α (-): This is the parameter of the van Genuchten water retention function.
Ks (cm/d): This value represents the saturated hydraulic conductivity.
θr (-): Represents the residual moisture content of the soil.
θs (-): Represents the saturated moisture content of the soil.
n (-): This is the value for the van Genuchten water retention function.
Nitrification Parameters
Knit (1/d): This is the maximum first-order nitrification rate.
Topt-nit (°C): This value represents the optimum soil temperature for nitrification.
βnit (-): This is the value for the empirical coefficient for the temperature function of nitrification.
e2 (-): Represents the empirical coefficient for the saturation function of nitrification.
e3 (-): This is the empirical coefficient for the saturation function of nitrification.
fs (-): This is the saturation function of the nitrification at full saturation.
fwp (-): Represents the saturation function of nitrification at the wilting point.
Swp (-): This is the degree of saturation at the wilting point.
Sl (-): Represents the lower limit of relative saturation for nitrification.
Sh (-): This is the upper limit of relative saturation for nitrification.
Denitrification Parameters
Kdnt (1/d): Represents the maximum first-order denitrification rate.
Topt-dnt (°C): This is the optimum soil temperature for denitrification.
βdnt (-): This is the empirical coefficient for the temperature function of denitrification.
e1 (-): This represents the empirical coefficient for the saturation function of denitrification.
Sdnt (-): Represents the threshold degree of saturation for denitrification.
(NH4-N) Adsorption Parameters
kd for NH4-N (cm3/g): The distribution coefficient describes the adsorbed concentrations.
Dispersion, Bulk Density, and Temperature Parameters
Dispersion coefficient (cm2/d): Represents the dispersion of contaminants in the soil.
ρ (g/cm3): Bulk density of the soil.
Temperature (°C): Soil temperature affecting chemical reactions and microbial activity.
Phosphorus Parameters
- Rprecip: The precipitation rate, represents the rate at which phosphate (PO43-)
precipitates out of solution and becomes immobilized in the soil. This process reduces the concentration of dissolved phosphate migrating through the vadose zone toward groundwater. A higher Rprecip value indicates more phosphate precipitation, lowering the risk of groundwater contamination. Proper calibration of this parameter, based on site-specific soil and environmental conditions, is essential for modeling phosphorus transport and attenuation.
Sorption isotherms:
Linear: Includes parameters for Linear distribution coefficient. The linear distribution coefficient (𝐾𝑑) represents the ratio of a solute’s concentration adsorbed onto the soil to its concentration in the soil solution, assuming a proportional and reversible adsorption process.
Langmuir: Includes parameters for the Langmuir coefficient, and the Maximum sorption capacity (mg P/kg). The Langmuir coefficient is a parameter that represents the affinity between the adsorbent surface and the solute, describing how strongly the solute binds to the adsorption sites. The maximum sorption capacity refers to the total amount of solute that can be adsorbed onto the surface at saturation, indicating the limit beyond which no additional solute can be adsorbed regardless of its concentration in the solution.
Outputs
The output files are saved in the folder specified by the users in the Output profile results (text file) field. The output folder should already exist. Otherwise, VZMOD raises an error and stops running. For the simulation with Single OSTDS selected, VZMOD generates an output file called results.txt. The output file name is not specified by the users but by VZMOD. If the output folder is not empty, when a new simulation is completed, the old output files are overwritten by the new output files. The results.txt file of Single OSTDS has the following columns:
Depth(cm): This column is the depth below the drainfield (cm).
Theta: This column is the calculated soil moisture at depth.
FSW_Nit: This column is the first-order reaction rate of nitrification adjusted for soil saturation at depth.
FSW_Dnt: This column is the first-order reaction rate of denitrification adjusted for soil saturation at depth.
C_NH4-N (mg/l): This column is the calculated ammonium concentrations at depth.
C_NO3-N (mg/l): This column is the calculated nitrate concentrations at depth.
C_PO4-P (mg/l): This column is the calculated phosphate concentration at depth.
An example of the result.txt text file is shown in Figure 3-12. When VZMOD is used at the neighborhood scale with Multiple OSTDS, the concentration data for every OSTDS are separated with the line “Calculating for septic tank X” added to the beginning of each data segment, where X is the FID of the OSTDS point and the sequence starts with zero. This file is stored in the user-specified output folder. In addition, the user may plot the concentration profiles generated by VZMOD in various environments such as Python or Microsoft Excel.
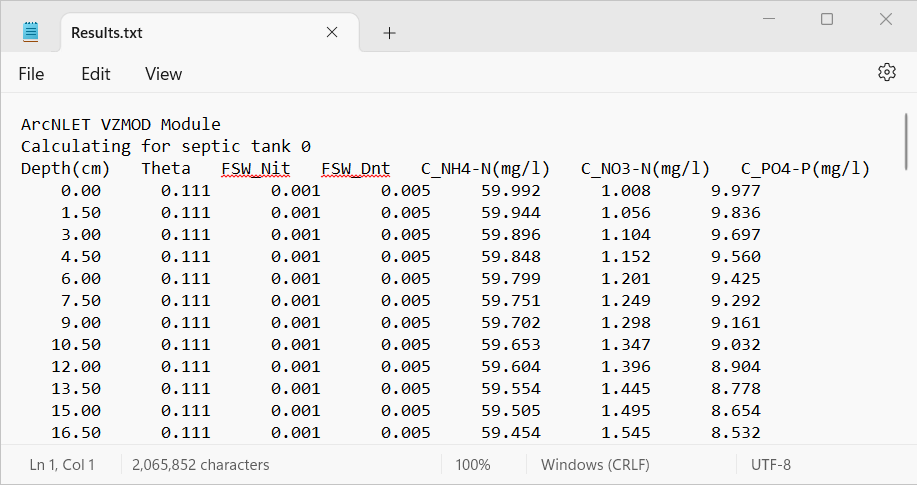
Figure 3-12: An excerpt from the results.txt file for the Lakeshore example.
If Multiple OSTDS checked, then VZMOD generates an additional output file, which is a point shapefile called septictanks.shp that is stored in the user-specified output folder. The new file is the same as the input Septic tank sources (point) file. If the Types of Contaminants is set to Nitrogen and Phosphorous, then there will be three new fields named C_NH4-N, C_NO3-N, and C_PO4-P. These new fields store the simulated concentrations at the groundwater table for each OSTDS. This updated septic tank file is a data input in the other ArcNLET-Py modules.
Troubleshooting
Table 3-1 lists a possible issue encountered during model execution, a possible cause, and a suggested solution. Note that the error messages may appear for reasons other than those listed. If you cannot find a solution to the issue, then please submit a [New issue] in the ArcNLET-Py GitHub repository (Issues · ArcNLET-Py/ArcNLET-Py · GitHub) as described in the GitHub instructions at Creating an issue - GitHub Docs.
Error |
Cause |
Solution |
|---|---|---|
Empty output datasets. |
An issue with the input data, an error in the file names, or ArcGIS Pro does not have read/write access to input or output file locations. |
Ensure all your data inputs/outputs are correct, in an accessible file folder, and uncorrupted. |
The module appears to run to completion, but the results.txt file is not data, and the “Fail. Unsupported operand type(s) for -: ‘NoneType’ and ‘int’” error is in the Messages pane. |
An issue occurs when running VZMOD from the History pane. |
Run VZMOD from the Catalog pane or Catalog view via the ArcNLET-Py toolbox. |