Using the VZMOD Module
The Vadose Zone Model (VZMOD) module simulates the flow and the transport of ammonium and nitrate in the Vadose Zone for single and multiple OSTDS locations. The module estimates ammonium and nitrate concentrations at OSTDS locations based on heterogeneous or homogeneous hydrologic conductivity, porosity, depth to the water table, and soil type. The module outputs are estimates of nitrification and denitrification between the OSTDS and the water table. Please note that the VZMOD Module is optional and allows for more precise estimates of ammonium and nitrate for use in the ArcNLET-Py Transport as the concentration of the source plane for groundwater modeling. The VZMOD Module requires knowledge of the study area and data preparation using USDA soil data.
Data Inputs
Once you are satisfied with the Particle Tracking Module’s data outputs, it is time to move on to the VZMOD Module. For this example, you run the VZMOD Module for multiple OSTDS locations with heterogeneous hydraulic conductivity and porosity and a soil type of sand and calculate the depth to the water table.
Access the [ArcNLET.pyt] ArcGIS Python Toolbox and the ArcNLET-Py ArcGIS Pro toolsets within.
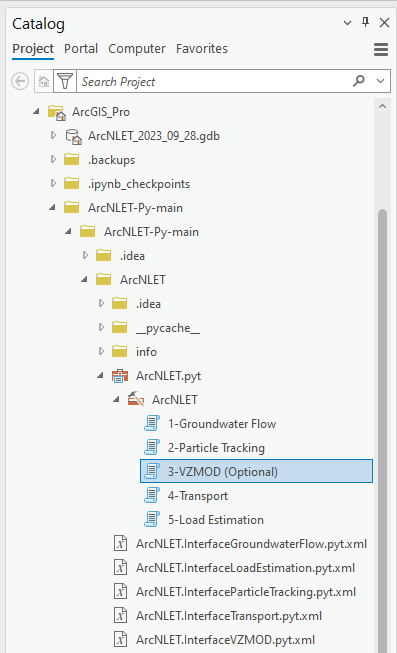
Figure 12-1: The ArcNLET-Py Python Toolset and VZMOD Module in the Catalog Pane
Double-click the [3-VZMOD (Optional)] module, and the VZMOD Python toolset opens in the [Geoprocessing Pane].
Take a moment to review the data inputs, outputs, and parameters. The VZMOD has many inputs and parameters based on using homogenous/heterogeneous hydraulic conductivity and porosity, calculating the depth to the water table, and using single/multiple soil types. Please remember that data inputs and outputs marked with a red asterisk [*] are required for the geoprocessing operation.
Click the drop-down arrow and the check boxes next to [Parameters] to expose the options.
Parameters (for the Lakeshore example):
Types of Contaminants
Lakeshore Example contaminants: [Nitrogen and Phosphorus]
Select Single or Multiple OSTDS from the Dropdown Menu
Lakeshore Example OSTDS: [Multiple OSTDS]
Selecting [Multiple OSTDS] allows for the use of heterogeneous hydraulic conductivity (K) and porosity (θ), calculating the depth to the water table, and using multiple soil types.
Heterogeneous Ks and θs
Option: [Enabled]
Calculate Depth to Water Table
Option: [Enabled]
Multiple Soil Types
Option: [Enabled]
Septic Tank Sources (Point)
Input vector point: [PotentialSepticTankLocations]
Hydraulic Conductivity (Raster)
Input raster: [hydr_cond]
Soil Porosity (Raster)
Input raster: [porosity]
Soil Types (Raster)
Input raster: [soiltype]
Concentration of NH4-N [mg/L]
Default value: [60]
Concentration of NO3-N [mg/L]
Default value: [1]
Concentration of PO4-P [mg/L]
Default value: [10]
Depth to Water Table [cm]
Default value: [150]
Output Profile Results (Text File)
Output file path: [C:UsersWeiDownloadslakeshore_example]
Hydraulic Params
Use default values
Nitrification Params
Use default values
Denitrification Params
Kdnt [1/d]: [0.08]
Topt-dnt [°C]: [26]
ßdnt [-]: [0.347]
Sdnt [-]: [0]
Dispersion, Bulk Density, and Temperature
Use default values
Phosphorus Params
Rprecip [mg/kg 1/day]: [0.0008]
Sorption Isotherm: [Linear]
Linear Distribution Coefficient [L/kg]: [15.1]
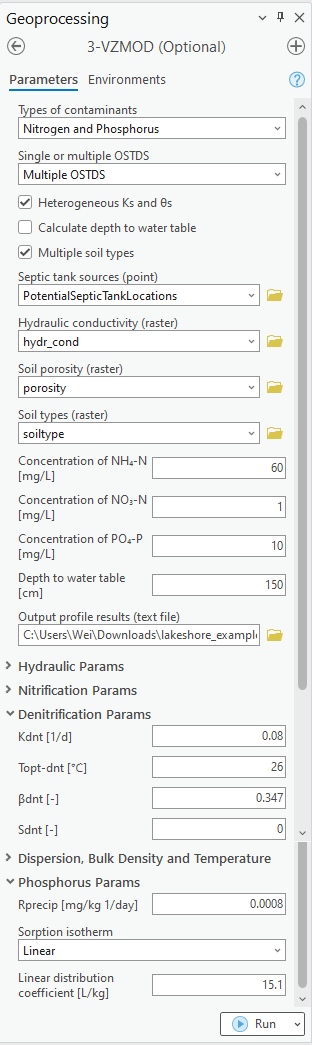
Figure 12-2: The VZMOD Module in the Geoprocessing Pane.
There are several options for selecting data for a geoprocessing tool in ArcGIS Pro. If you are unfamiliar with ArcGIS Pro geoprocessing tools, please use the following URL to learn how to use geoprocessing tools. URL: https://pro.arcgis.com/en/pro-app/latest/help/analysis/geoprocessing/basics/run-geoprocessing-tools.htm
Use the [Map], [Catalog View], [Catalog Pane], or [Folder Icon] to select the necessary data inputs.
If you have the data from the Lakeshore example in a [Map] in your ArcGIS Pro Project file and the [Geoprocessing Pane] open, you can drag and drop the necessary inputs or select the files from the drop-down menu for each of the input fields.
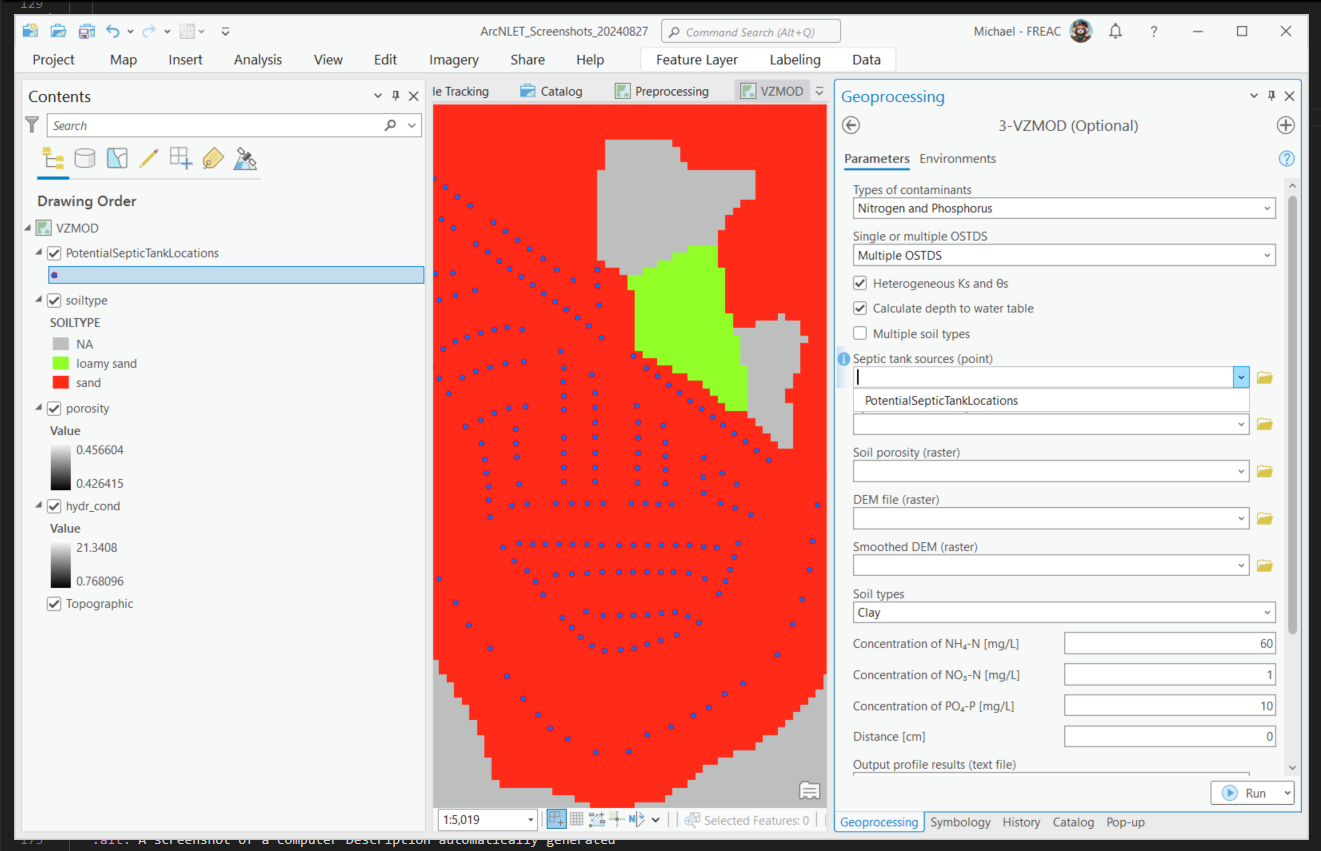
Figure 12-3: Selecting VZMOD Module data inputs in the Map View.
If you have the data from the Lakeshore example open in a [Catalog Pane] or [Catalog View] and the [Geoprocessing Pane] open, then you can drag and drop the necessary inputs.
You can also click the [Folder Icon] next to each field to select the data inputs using the Windows File Explorer. To use this method, you must use the Windows File Explorer to navigate to the […\2_lakeshore_example_phosphorus\3_VZMOD_module\Inputs] folder to select each data input and click [OK].
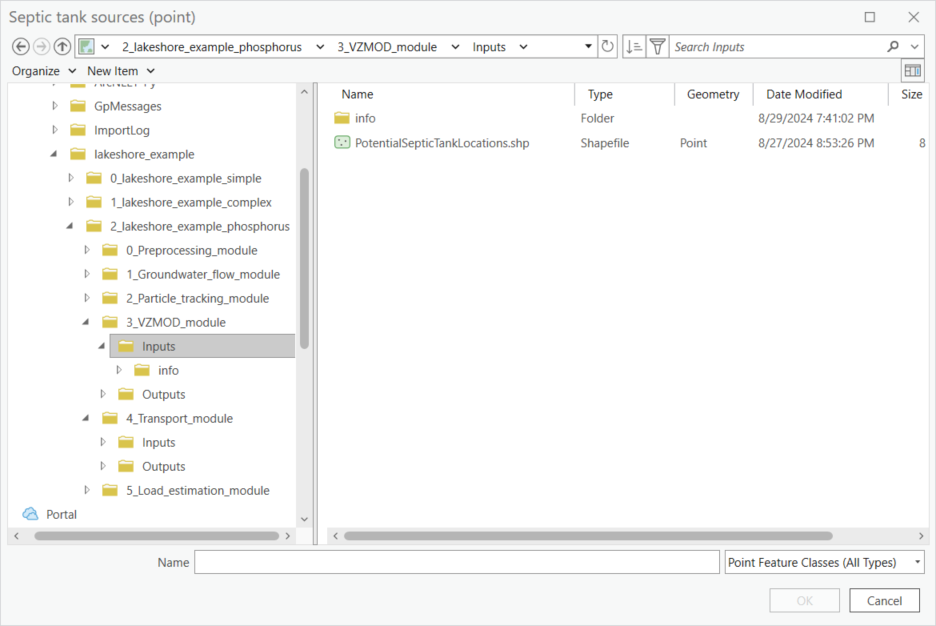
Figure 12-4: Selecting VZMOD Module inputs from the Windows File Explorer.
Data Outputs and Parameters
Storing your files in an organized and appropriately named manner is good practice when selecting locations for data outputs. Earlier in this exercise, we used the Windows File Explorer or ArcGIS Pro [Catalog Pane] to create a new folder titled [LakeshoreExampleOutputs_YYYY_MM_DD]. The folder stores the output shapefiles.
If you need to create a new file folder in ArcGIS Pro, use the [Catalog Pane], right-click on the folder […\2_lakeshore_example_phosphorus\3_VZMOD_module\Outputs], hover over the option [New] in the submenu, and click [Folder].
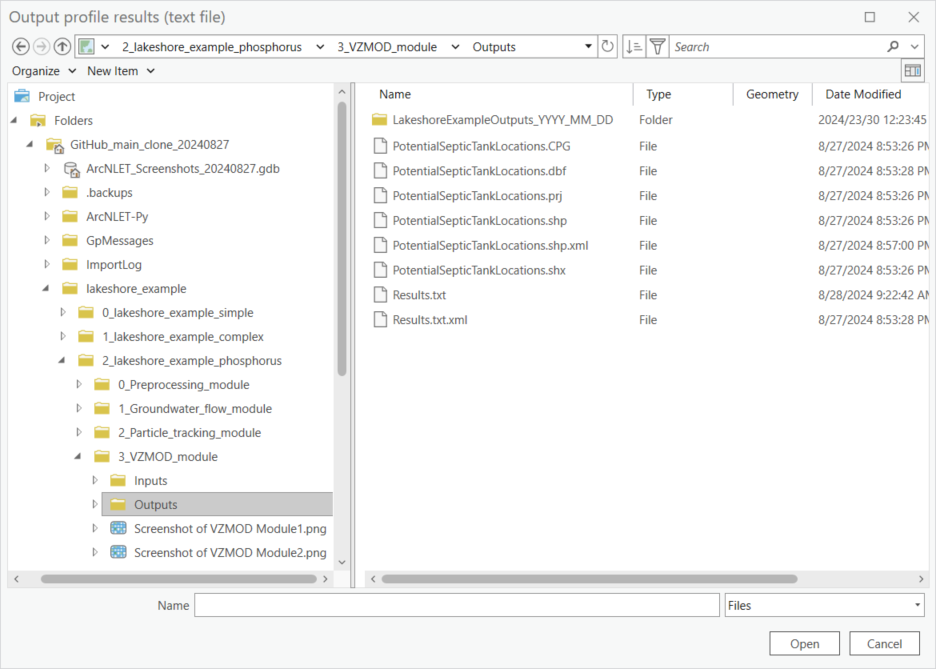
Figure 12-5: The Lakeshore example output folders in the Windows File Explorer.
Select the necessary data output folder by clicking the [Folder Icon] next to the [Output folder] field in the [Geoprocessing Pane]. The results from the VZMOD Module are a text file labeled [results.txt] and a point shapefile with ammonium and nitrate concentration estimates at the water table.
The Windows File Explorer opens, and in the left pane under [Project], click the drop-down arrows to expand the [Folders] and ArcGIS Pro home folders.
Select the […\2_lakeshore_example_phosphorus\3_VZMOD_module\Outputs] folders.
Click the above output folder to store the output text file and shapefile from the VZMOD Module. The file path and name for the [Output] folder is […\2_lakeshore_example_phosphorus\3_VZMOD_module\Outputs], or your custome output folder should be in the following directory […\2_lakeshore_example_phosphorus\3_VZMOD_module\Outputs\LakeshoreExampleOutputs_YYYY_MM_DD].
The module automatically names the text file and shapefile outputs.
The ArcNLET-Py ArcGIS Pro Python toolset automatically assigns the correct file types, and if you enter a file type, a warning is triggered.
Data output:
The Output folder
Lakeshore Example output folder: […\2_lakeshore_example_phosphorus\3_VZMOD_module\Outputs]
The outputs of VZMOD are a CSV text file titled [Results.txt] that contains the vertical fate and decay of nitrate and ammonia below the OSTDS and [PotentialSepticTankLocations.shp] shapefile when processing data for [Multiple OSTDS].
Double-check to ensure all red astricts [*] are removed from the [Geoprocessing Pane], indicating that all necessary data inputs and outputs have the correct file type and are accessible as shown in Figure 12-2.
Execute the Module
Once satisfied with the data input and output selections, click [Run] in the [Geoprocessing Pane].
Figure 12-6: The Run button in the Geoprocessing Pane.
ArcNLET-Py VZMOD Module begins to process data, and the progress bar appears. The runtime can vary depending on the data sets’ file sizes, spatial scale, and raster cell size.
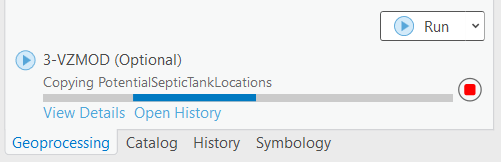
Figure 12-7: The Progress Bar in the ArcGIS Pro Geoprocessing Pane for the VZMOD Module.
ArcGIS Pro indicates the tool is finished with a green notification box at the bottom of the [Geoprocessing Pane]. You may click [View Details] for more information about the process, including data inputs and output(s), start and end times and dates, and a success or failure message.
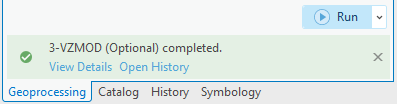
Figure 12-8: The green notification box in the ArcGIS Pro Geoprocessing Pane for the VZMOD Module.
View and Verify Results
If you have your data inputs in an open [Map] in ArcGIS Pro, the data output(s) are automatically added to the [Contents Pane] and the [Map View]. Alternatively, if you do not have your input data in a [Map], nor do you have a [Map View] open in your ArcGIS Pro Project, and you ran the ArcNLET-Py VZMOD Module from the [Geoprocessing Pane], then your results are accessible via the [Catalog Pane] or [Catalog View] in the […\2_lakeshore_example_phosphorus\3_VZMOD_module\Outputs] folder or in your custom output folder (i.e., [LakeshoreExampleOutputs_YYYY_MM_DD]). Please note that you may want to use a separate output folder each time you run VZMOD to aid in data organization.
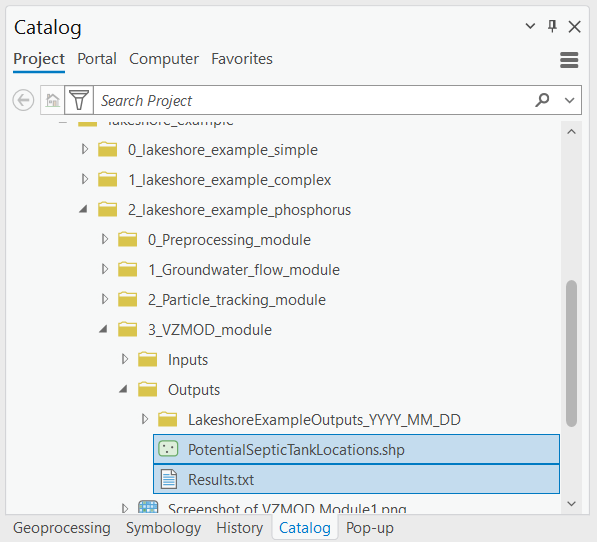
Figure 12-9: The ArcNLET-Py VZMOD output in the Catalog Pane.
Take a moment to review the text file and shapefile outputs to ensure your data has been processed correctly. Your data must be processed correctly because data outputs from the VZMOD Module are inputs in the subsequent module.
If there seems to be an issue with the output particle paths shapefile, please ensure all your data inputs are correct, in an accessible file folder, and uncorrupted.
If you continue having issues processing your data, please [View Details] as previosuly to see if empty datasets were created as outputs. Empty datasets indicate an issue with the input data, or ArcGIS Pro does not have read/write access to input or output file locations.
If you cannot find a solution to the issue, then please submit a [New issue] in the ArcNLET-Py GitHub repository
(Issues · ArcNLET-Py/ArcNLET-Py · GitHub) as described in the GitHub instructions at Creating an issue - GitHub Docs.
The [Results.txt] file can be modified so that it is compatible with Excel. To see the verticle profile for one OSTDS in Excel you must located the desired septic tank number in the [Results.txt] file.
Note that when using the multiple OSTDS option, the Results.txt file contains the simulation outcomes for all OSTDS locations. Even if the same initial concentration is assigned to each drainfield, the final concentrations entering the groundwater through the unsaturated zone may still differ significantly. This is because soil properties—such as soil type, hydraulic conductivity, and porosity—vary among OSTDS locations, leading to substantial differences in nitrogen nitrification and denitrification processes within the unsaturated zone. Based on the output results in [Results.txt], please select several representative OSTDS locations for further analysis and plotting.
Next, you must copy and paste the headers and data for a given location into a new text file.
Afterwards, you may import the text file into Excel using the [Text Import Wizard] with [Fixed width] and [My data has headers] options selected.
Create plots showing the vertical profile.
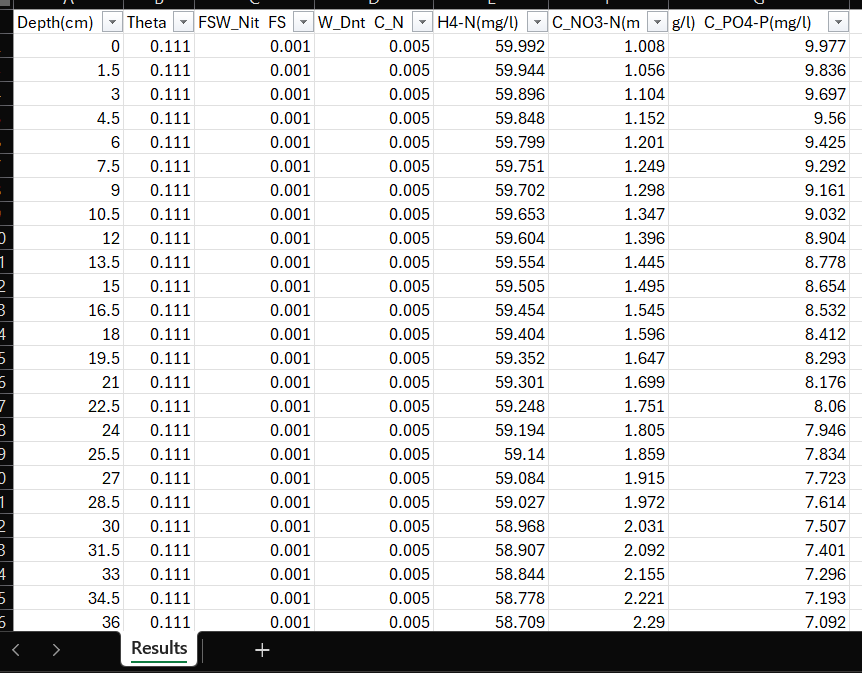
Figure 12-10: The ArcNLET-Py VZMOD text outputs in Microsoft Excel.
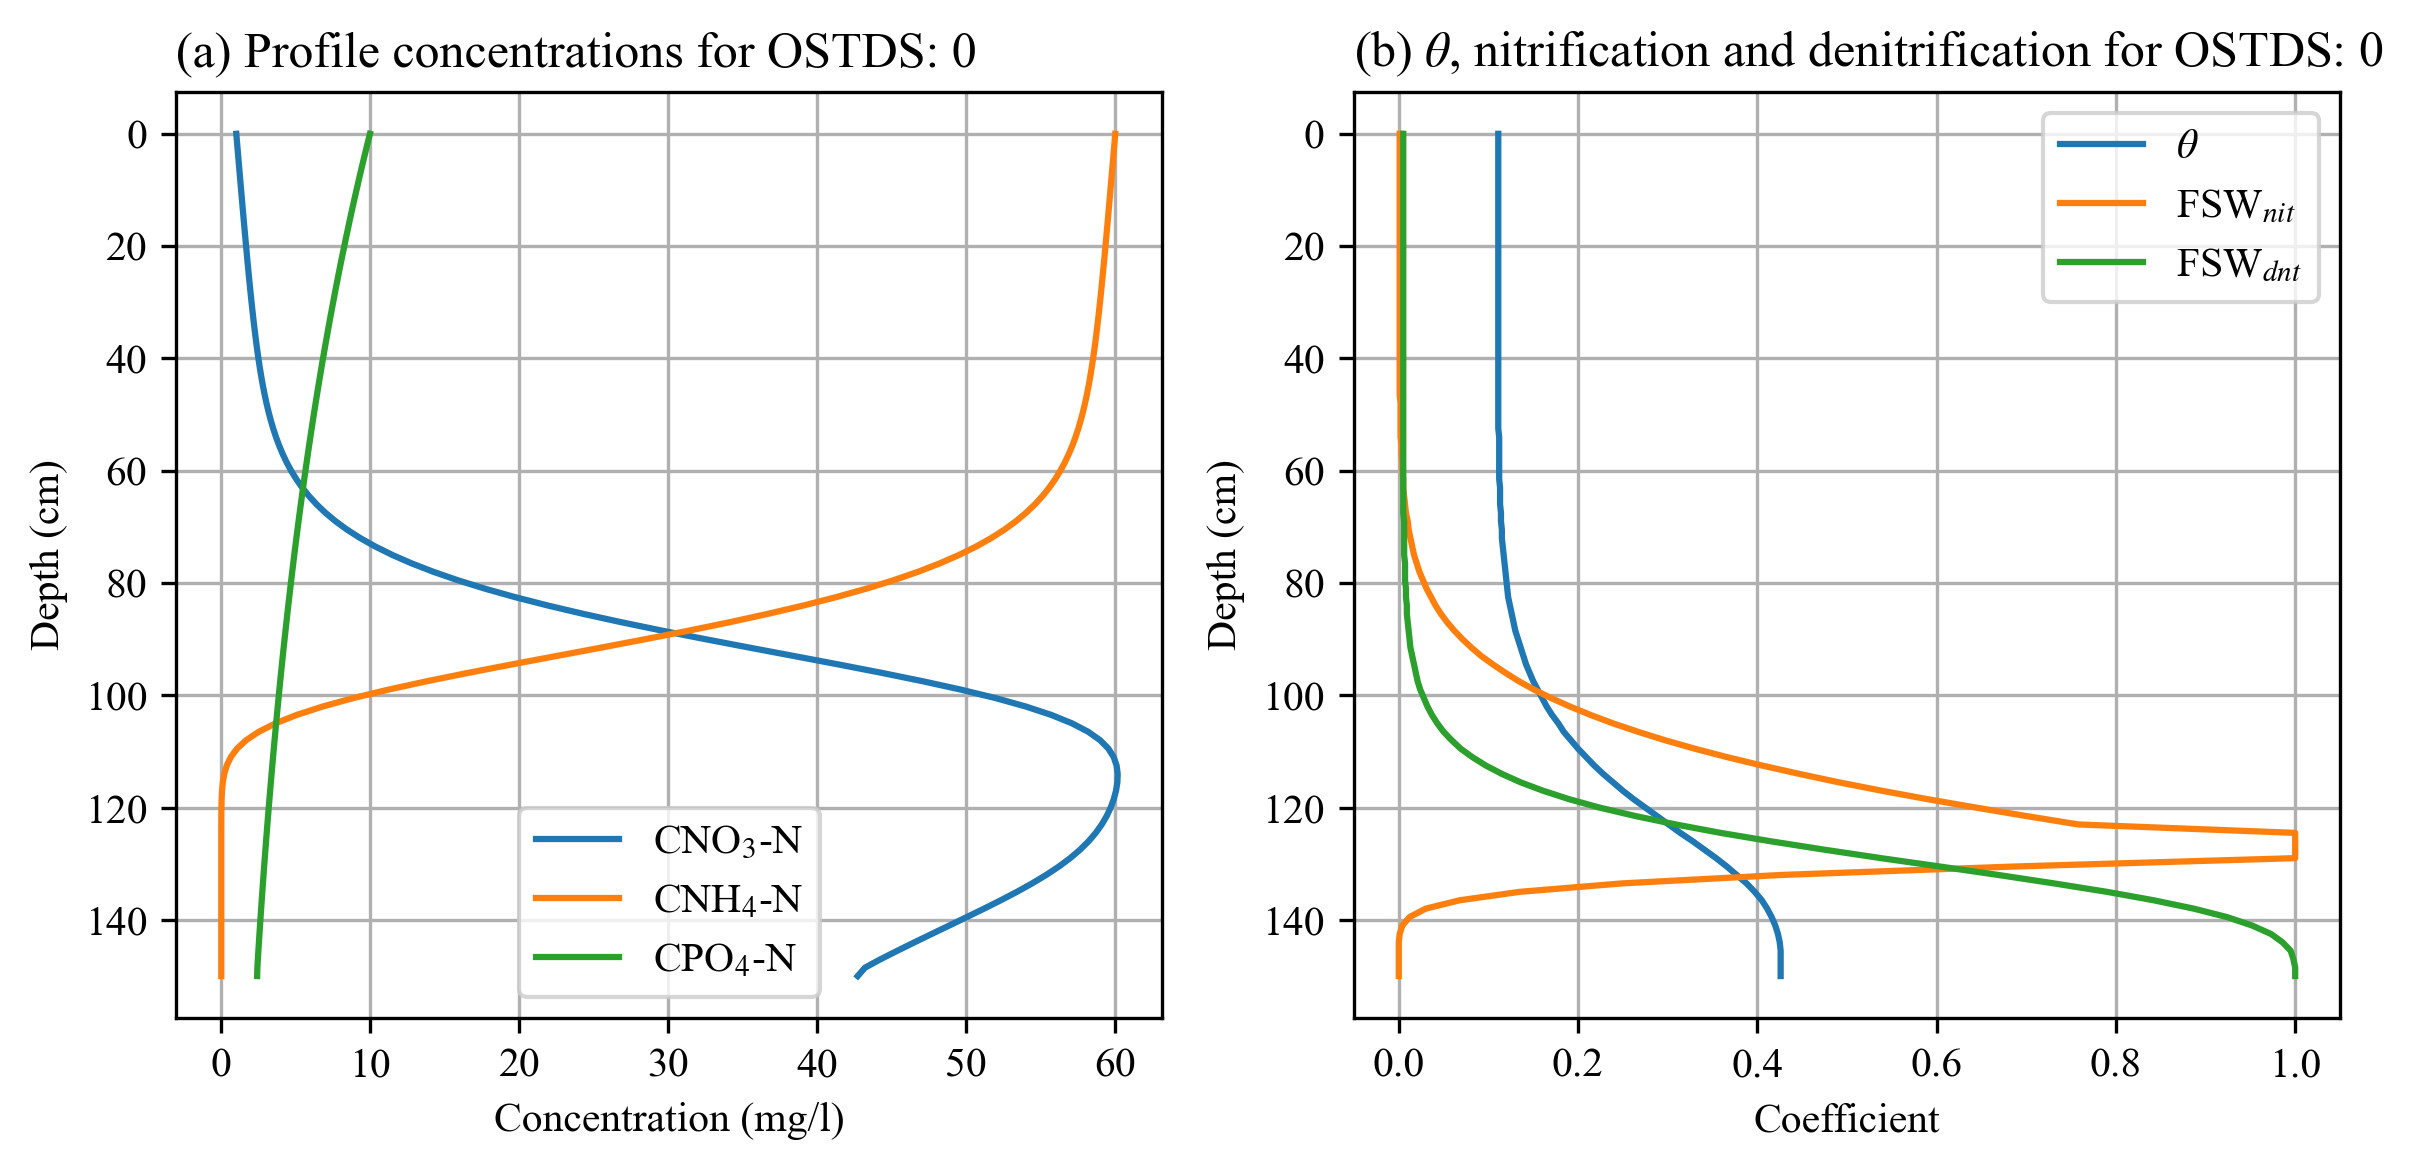
Figure 12-11: The ArcNLET-Py VZMOD text outputs are plotted in Excel.
The plots show concentrations of NH4, NO3, and PO43- below the OSTDS (left) and the saturation function for nitrification and denitrification (right).