Using the Transport Module
The Transport Module uses the Particle Tracking Module particle paths to simulate ammonium and nitrate plumes originating from the potential septic tank locations traveling toward the water bodies. This module also calculates the inflow mass from the septic tanks into the groundwater and the amount of mass removed by denitrification.
Data Inputs
Once you are satisfied with the Particle Tracking Module’s data outputs, it is time to move on to the Transport Module. Access the [ArcNLET.pyt] ArcGIS Python Toolbox and the ArcNLET-Py ArcGIS Pro toolset.
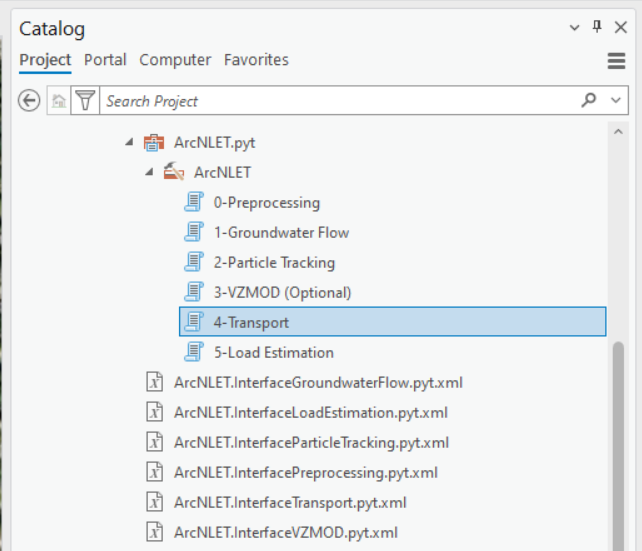
Figure 13-1: The ArcNLET-Py Python Toolset and Transport Module in the Catalog Pane.
Double-click the [4 Transport] module, and the Transport Python toolset opens in the [Geoprocessing Pane].
Take a moment to review the data inputs, outputs, options, and parameters. Please remember that data inputs and outputs marked with a red asterisk [*] are required for the geoprocessing operation.
Click the drop-down arrow next to [Options] and [Parameters] to expose the choices.
Types of Contaminants
Contaminants to be considered: [Nitrogen and Phosphorus]
Consideration of NH4
Default option: [Enabled]
Data Inputs:
Input Source Locations (point)
Lakeshore Example input vector point: [PotentialSepticTankLocations]
Input Water Bodies (polygon)
Lakeshore Example input water body polygons: [waterbodies]
Input Particle Paths (polyline)
Lakeshore Example input polyline: [paths50]
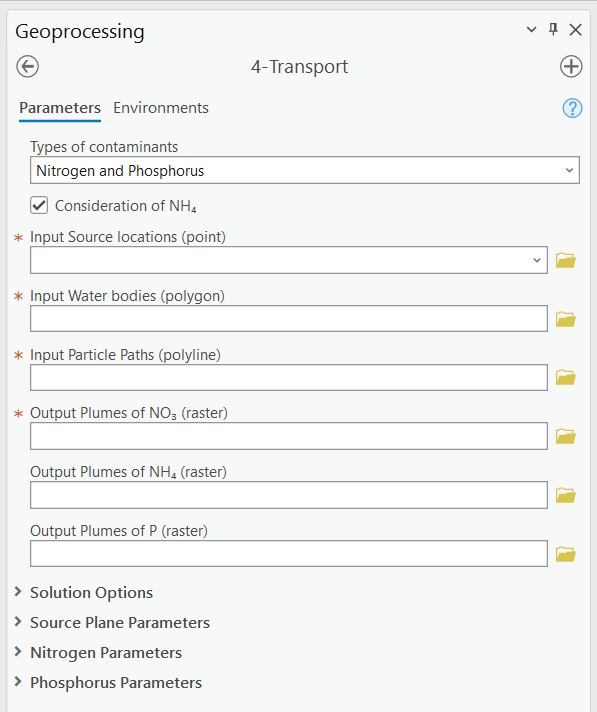
Figure 13-2: The Transport Module in the Geoprocessing Pane.
There are several options for selecting data for a geoprocessing tool in ArcGIS Pro. If you are unfamiliar with ArcGIS Pro geoprocessing tools, please use the following URL to learn how to use geoprocessing tools. URL: https://pro.arcgis.com/en/pro-app/latest/help/analysis/geoprocessing/basics/run-geoprocessing-tools.htm
Use the [Map], [Catalog View], [Catalog Pane], or [Folder Icon] to select the necessary data inputs.
If you have the data from the Lakeshore example in a [Map] in your ArcGIS Pro Project file and the [Geoprocessing Pane] open, you can drag and drop the necessary inputs or select the files from the drop-down menu for each of the input fields.
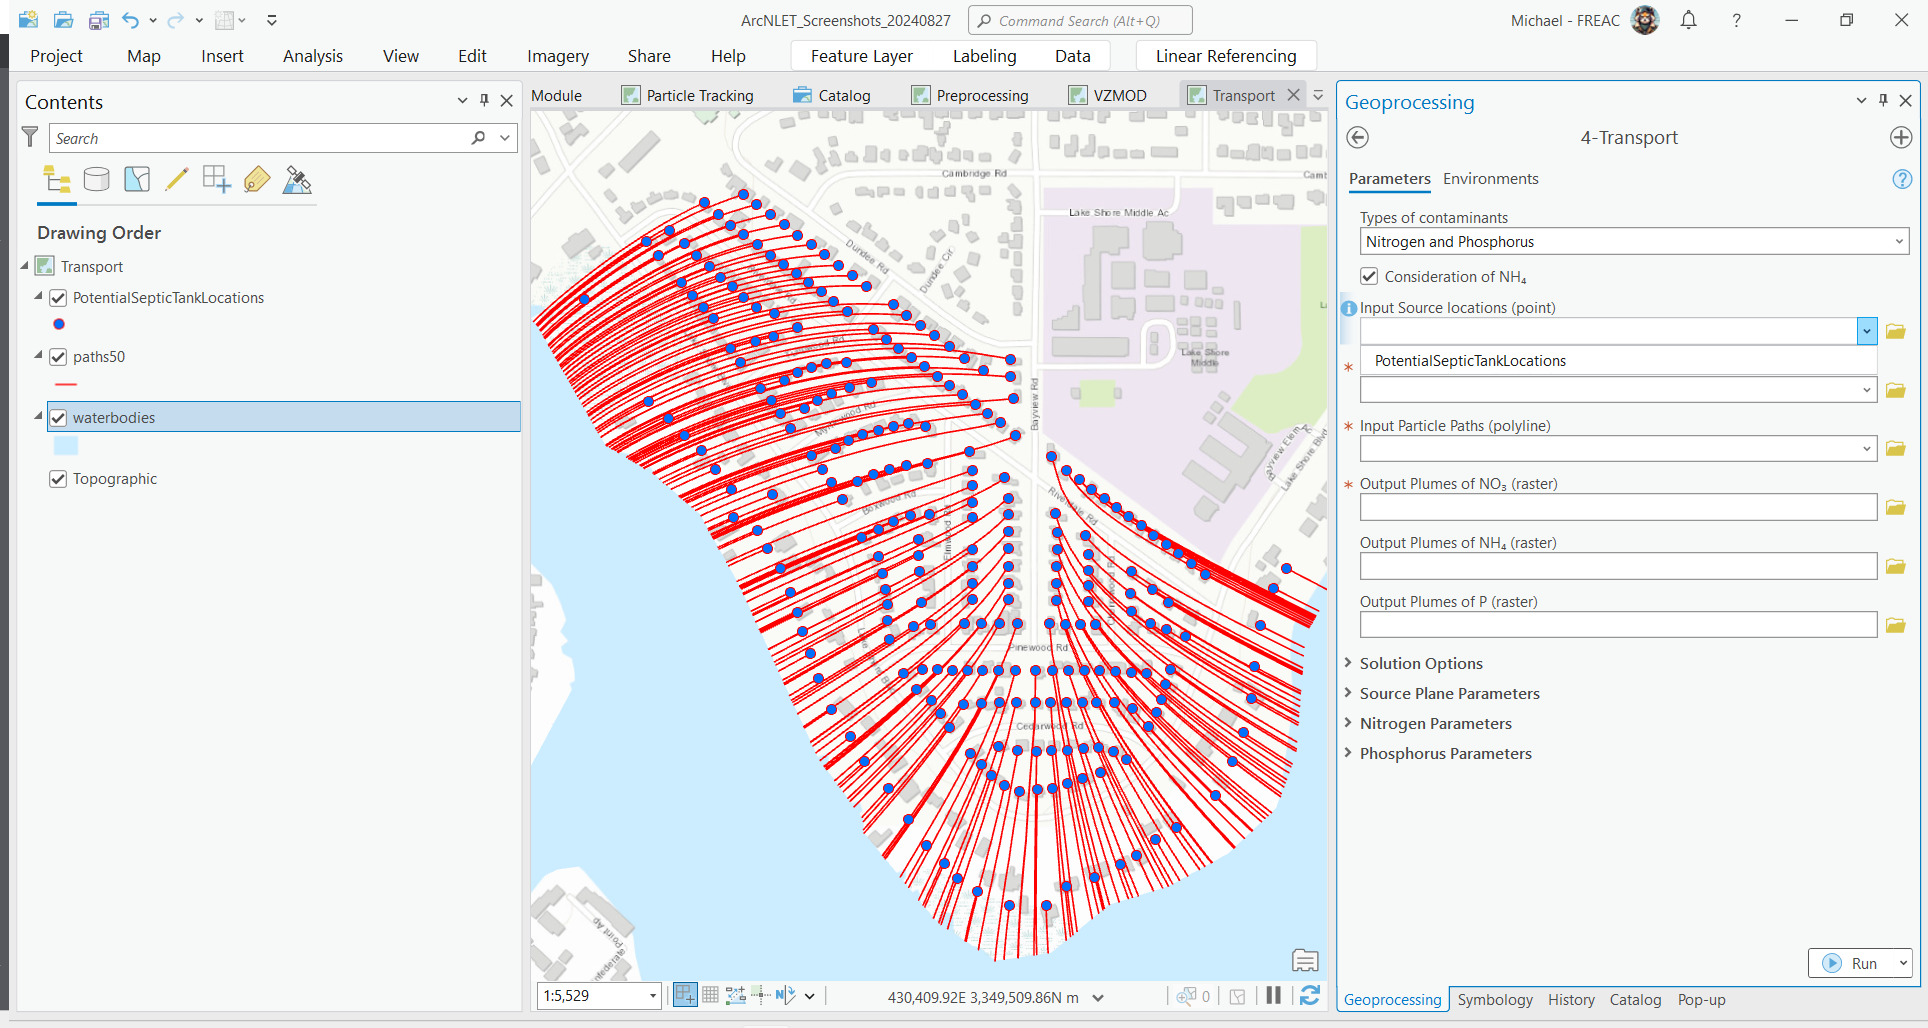
Figure 13-3: Selecting Transport Module data inputs in the Map View.
If you have the data from the Lakeshore example open in a [Catalog Pane] or [Catalog View] and the [Geoprocessing Pane] open, then you can drag and drop the necessary inputs.
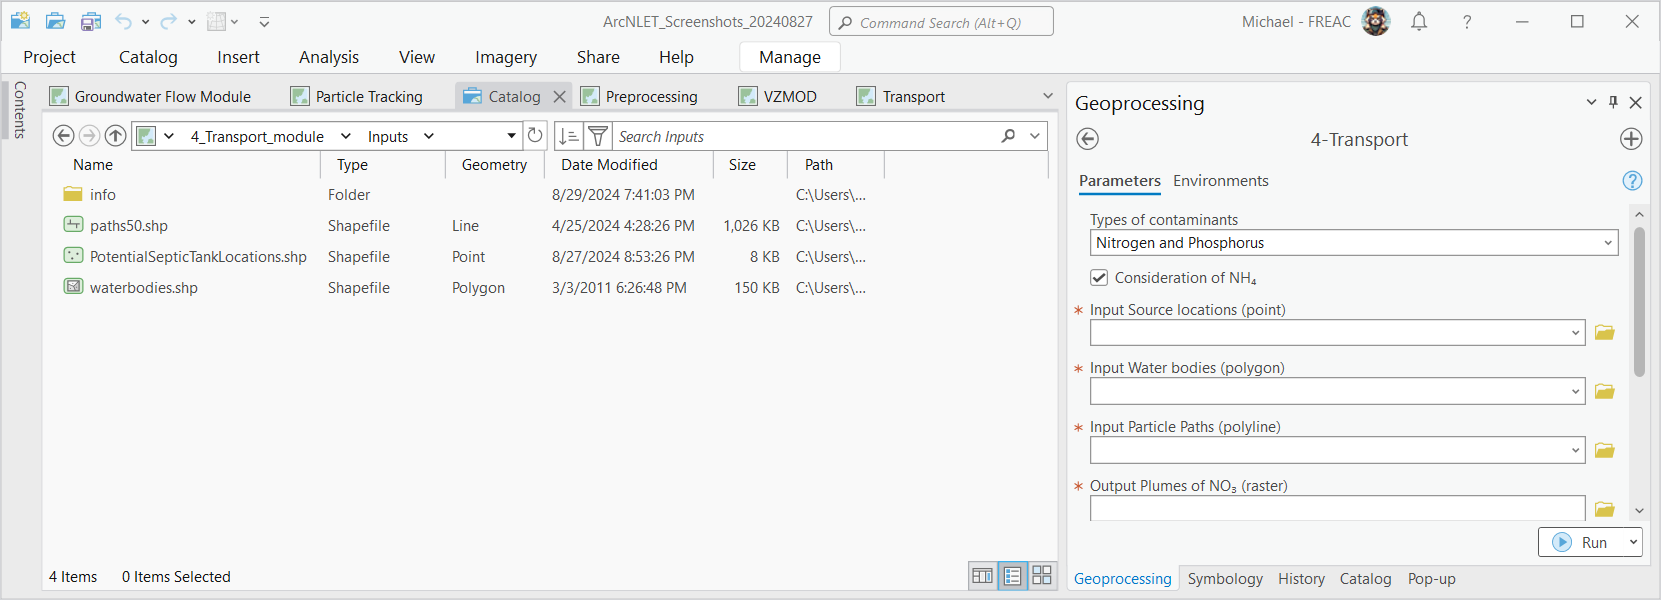
Figure 13-4: Selecting the Transport Module inputs by dragging and dropping from the Catalog View.
You can also click the [Folder Icon] next to each field to select the data inputs using the Windows File Explorer. To use this method, you must use the Windows File Explorer to navigate to the […\lakeshore_example\2_lakeshore_example_phosphorus\4_Transport_module\Inputs] and click [OK].
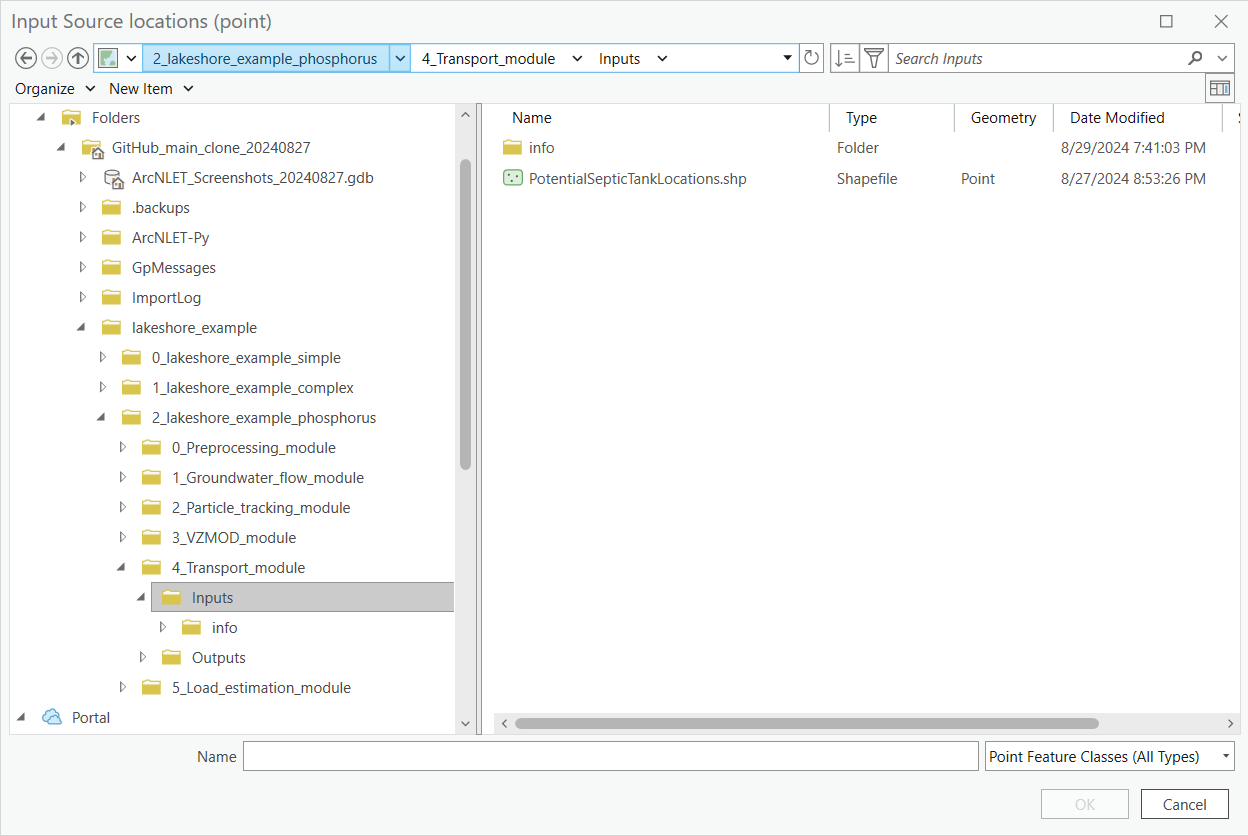
Figure 13-5: Selecting Transport Module inputs from the Windows File Explorer.
Data Outputs and Parameters
Storing your files in an organized and appropriately named manner is good practice when selecting locations for data outputs. Earlier in this exercise, we used the Windows File Explorer or ArcGIS Pro [Catalog Pane] to create a new folder titled [LakeshoreExampleOutputs_YYYY_MM_DD]. The folder stores the output raster images.
If you need to create a new file folder in ArcGIS Pro, use the [Catalog Pane], right-click on the folder […\2_lakeshore_example_phosphorus\4_Transport_module\Outputs], hover over the option [New] in the submenu, and click [Folder].
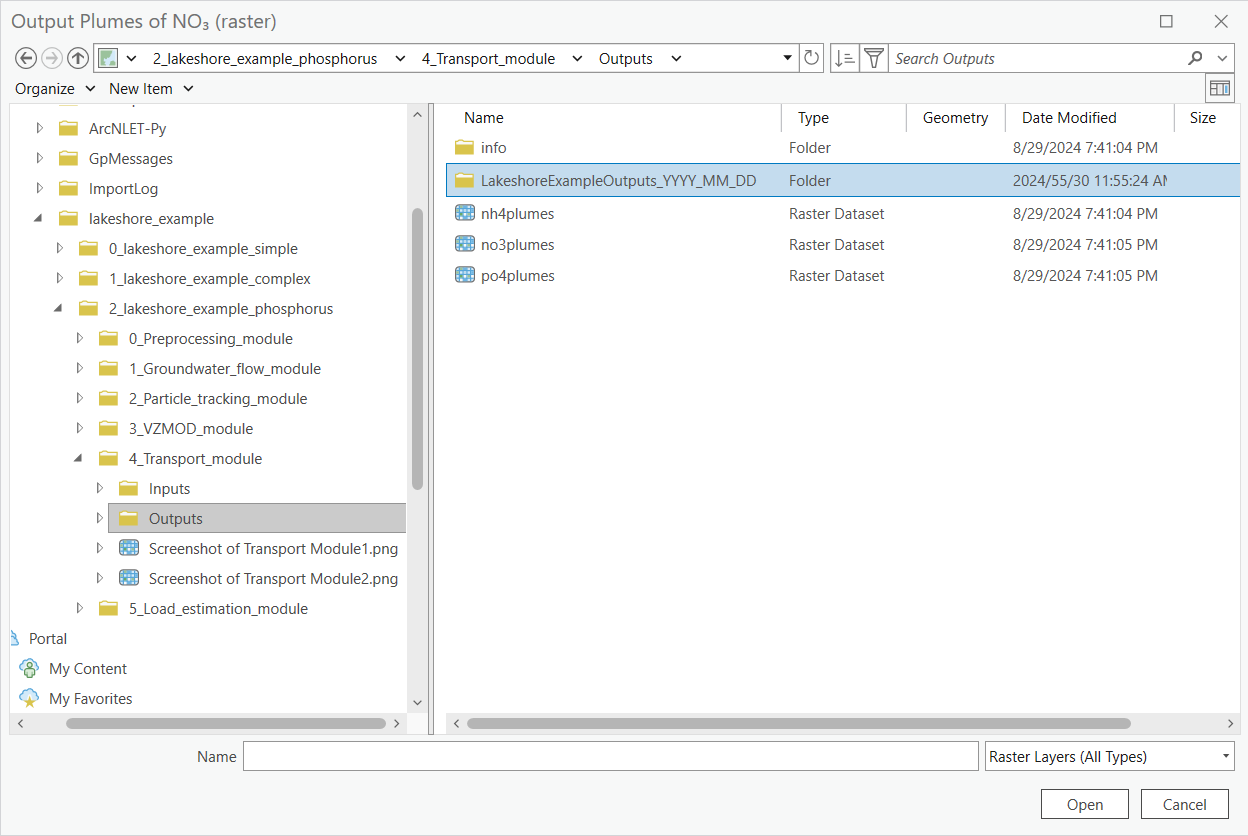
Figure 13-6: The Lakeshore example output folders in the Windows File Explorer.
Select the necessary data output by clicking the [Folder Icon] next to the [Output Plumes of NO3 (raster)] field in the [Geoprocessing Pane].
The Windows File Explorer opens, and in the left pane under [Project], click the drop-down arrows to expand the [Folders] and ArcGIS Pro home folder.
Select the […\2_lakeshore_example_phosphorus\4_Transport_module\Outputs] folder.
Click the output folder to store the output raster in the Transport Module. The file path and name for the output [Output Plumes of NO3 (raster)] for this example is: […\2_lakeshore_example_phosphorus\4_Transport_module\Outputs\no3plumes]
Type the name of the raster output into the [Name] field with no file extension and click [OK].
The ArcNLET-Py ArcGIS Pro Python toolset automatically assigns the correct file types, and if you enter a file type, a warning is triggered.
Please note that when typing the data output into the provided field in the [Geoprocessing Pane], the outputs are automatically stored in the specified outputs folder […\2_lakeshore_example_phosphorus\4_Transport_module\Outputs].
Data output:
Output Plumes of NO3 (raster)
Lakeshore Example output raster: [no3plumes]
Output Plumes of NH4 (raster)
Lakeshore Example output raster: [nh4plumes]
Output Plumes of P (raster)
Lakeshore Example output raster: [po4plumes]
The Options are related to the Domenico Robbins solution type for two-dimensional (2-D) denitrification (decay).
Solution Type
Selected type: [DomenicoRobbinsSSDecay2D]
Plume Warping Control
Point spacing [Cells]: [48]
Plume warping method: [Spline]
Threshold Concentration [mg/l]
Set threshold value: [0.000001]
Postprocessing Medium
Use default settings
Domenico Boundary
Specified Z: [400]
The Parameters are related to the septic tank size, the nitrogen mass going into the septic tank for a specific timeframe, and the width of the septic tank.
Source Dimension Y [m]
Default value: [48]
Source Dimension Z [m]
Default value: [2]
Plume Cell Size [m]
Default value: [1.5]
NO3 Concentration [mg/l]
Default value: [40]
NO3-N Dispersivity aL [m]
Default value: [2.113]
NO3-N Dispersivity aTH [m]
Default value: [0.234]
Denitrification Decay Rate [1/d]
Default value: [0.04]
Volume Conversion Factor
Default value: [1000]
Bulk Density [g/cm³]
Default value: [1.42]
Nitrogen Parameters:
NH4-N Dispersivity aL [m]
Default value: [2.113]
NH4-N Dispersivity aTH [m]
Default value: [0.234]
Nitrification Decay Rate [1/d]
Default value: [0.0001]
kd for NH4-N [cm³/g]
Default value
Phosphorus Parameters:
PO4-P Dispersivity aL [m]
Default value: [2.113]
PO4-P Dispersivity aTH [m]
Default value: [0.234]
Rprecip [mg/kg 1/day]
Default value: [0.002]
Sorption Isotherm
Type: [Linear]
Linear Distribution Coefficient [L/kg]
Default value: [15.1]
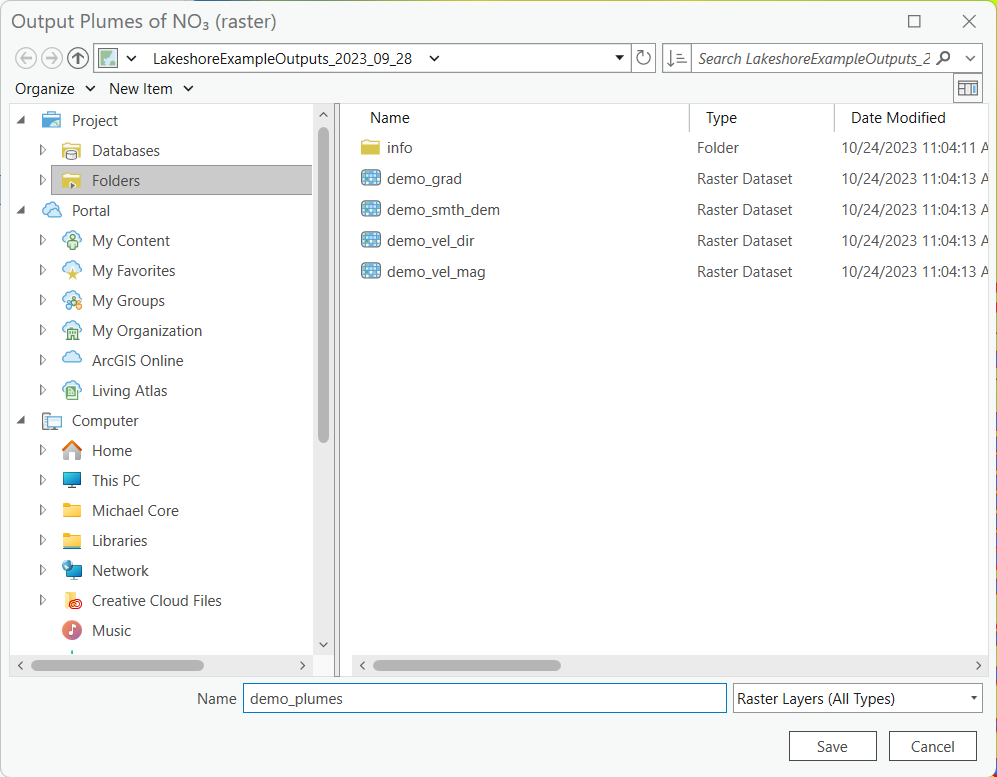
Figure 13-7: Selecting the data output location from the Windows File Explorer for the Transport Module.
Double-check to ensure all red astricts [*] are removed from the [Geoprocessing Pane], indicating that all necessary data inputs and outputs have the correct file type and are accessible.
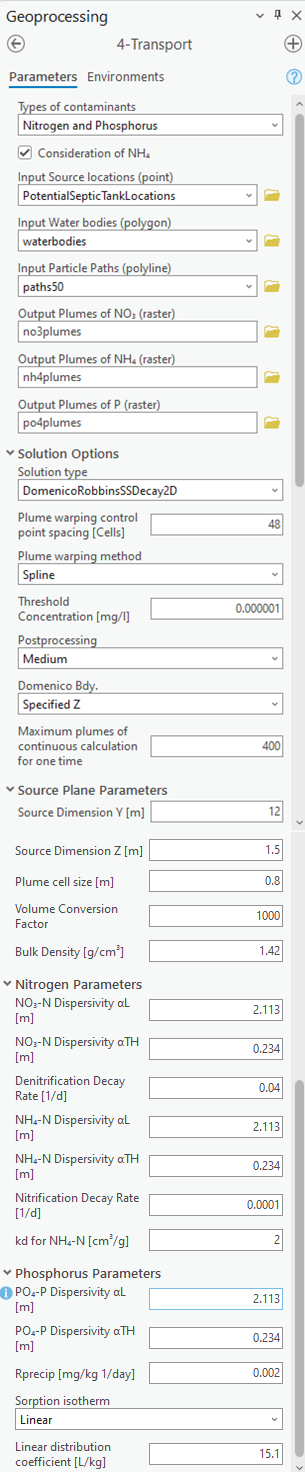
Figure 13-8: The Transport Module Data inputs and output in the Geoprocessing Pane.
Execute the Module
Once satisfied with the data input and output selections, click [Run] in the [Geoprocessing Pane].
Figure 13-9: The Run button in the Geoprocessing Pane.
The ArcNLET-Py Transport Module begins to process data, and the progress bar appears.
Please note that the runtime can be lengthy depending on the data sets’ file sizes, spatial scale, and raster cell size.
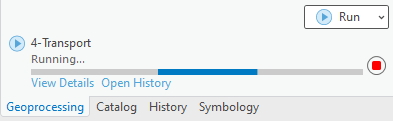
Figure 13-10: The Progress Bar in the ArcGIS Pro Geoprocessing Pane for the Transport Module.
If you feel the process has stalled or frozen, please click [View Details] below the blue progress bar. In the dialog box, click [Messages], then scroll to the bottom to ensure plumes are calculated for each septic tank location. New messages should populate the window until the process is complete.
Your Messages have a number that differs on your machine from the example depending on how many plumes have been processed.
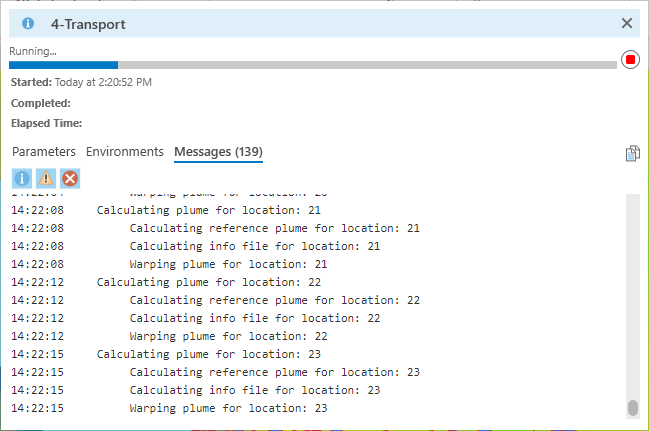
Figure 13-11: The Messages box showing calculating plumes for OSTDS.
ArcGIS Pro indicates the tool is finished with a green notification box at the bottom of the [Geoprocessing Pane]. You may click [View Details] for more information about the process, including data inputs and output(s), start and end times and dates, and a success or failure message.
Figure 13-12: The green notification box in the ArcGIS Pro Geoprocessing Pane for the Transport. Module.
View and Verify Results
If you have your data inputs in an open [Map] in ArcGIS Pro, the data output(s) are automatically added to the [Contents Pane] and the [Map View].
Alternatively, if you do not have your input data in a [Map], nor do you have a [Map View] open in your ArcGIS Pro Project, and you ran the ArcNLET-Py Transport Module from the [Geoprocessing Pane], then your results are accessible via the [Catalog Pane] or [Catalog View] in the output folder […\2_lakeshore_example_phosphorus\4_Transport_module\Outputs].
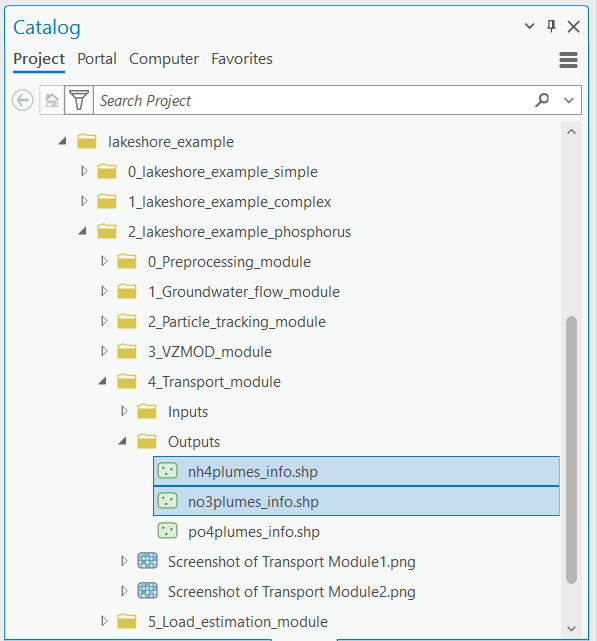
Figure 13-13: The ArcNLET-Py Transport Module outputs in the Catalog Pane.
Take a moment to review the outputs, as shown in Figures 13-14, 13-15, and 13-16 to ensure your data has been processed correctly. Your data must be processed correctly because data outputs from the Transport Module are used as inputs in the Load Estimation Module.
Your raster image outputs appear in your [Map View] as a black image with white plumes with the greatest magnitude at each potential septic tank location, and the plume diminishes towards the water bodies. This black-and-white symbology is not an indicator that there is an error. A solid black raster image in a [Map View] in ArcGIS Pro indicated that proper symbology is not set for the raster layer.
Please note that if your raster image outputs have a solid black fill with only null or no-data values, then this is an indicator that there might have been an error processing the data inputs. Please ensure all your data inputs are correct, in an accessible file folder, and are uncorrupted.
Your vector shapefile outputs appear as point features marking your potential septic tank locations.
If the shapefile is empty, then this indicates that there might have been an error processing the data inputs. Please ensure all your data inputs are correct, in an accessible file folder, and are uncorrupted.
If you continue having issues processing your data, please [View Details] to see if empty datasets were created as outputs. Empty datasets indicate an issue with the input data, or ArcGIS Pro does not have read/write access to input or output file locations.
If you cannot find a solution to the issue, then please submit a [New issue] in the ArcNLET-Py GitHub repository (Issues · ArcNLET-Py/ArcNLET-Py · GitHub) as described in the GitHub instructions at Creating an issue - GitHub Docs.
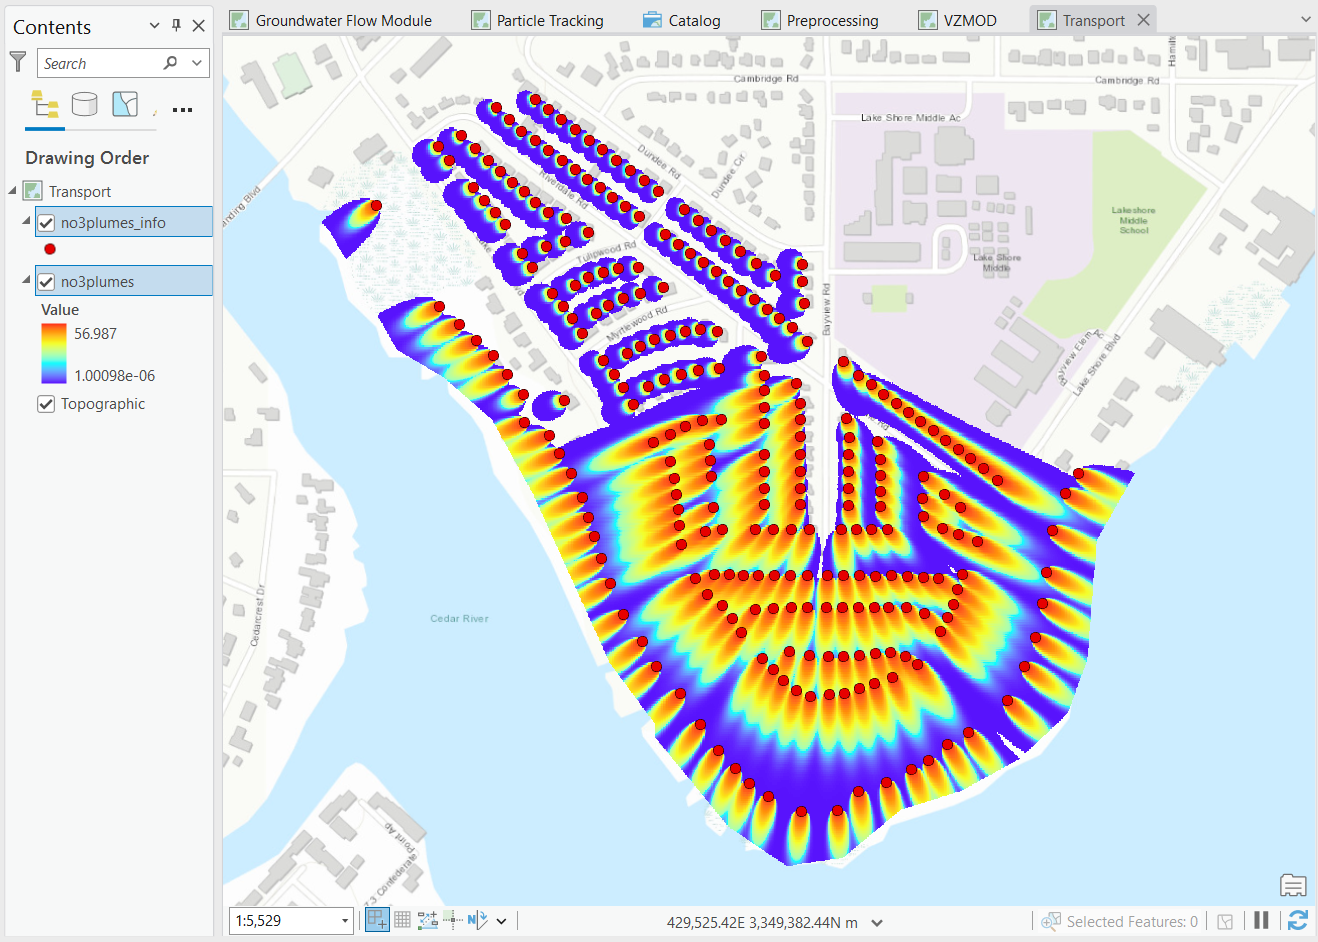
Figure 13-14: The ArcNLET-Py Transport Module outputs in the Contents Pane and Map Figure for NO3
The NO3 plumes are shown with the highest magnitude in red, and analyte levels near zero are purple. The water body is shown in blue.
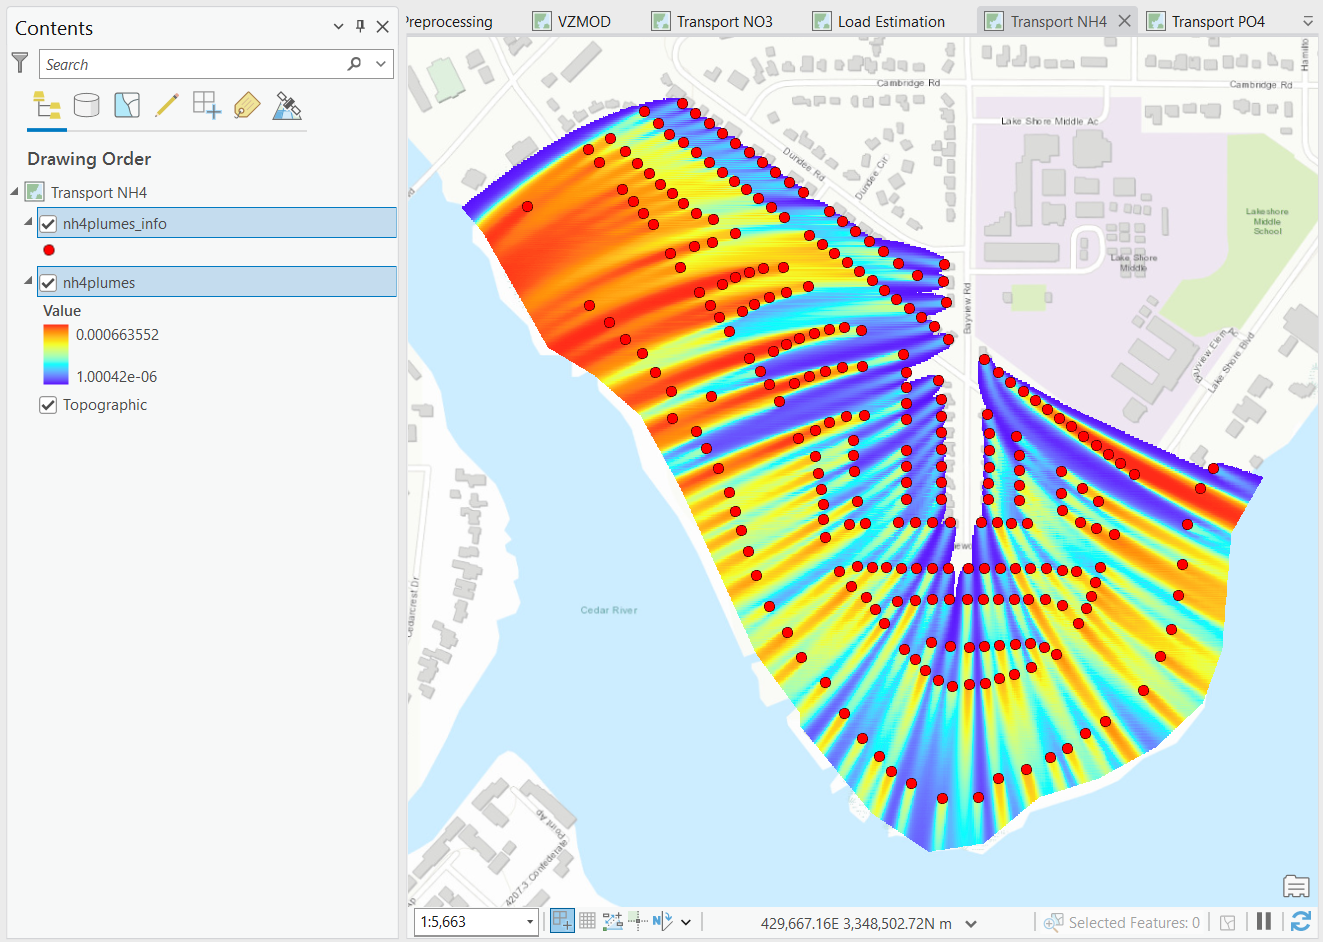
Figure 13-15: The ArcNLET-Py Transport Module outputs in the Contents Pane and Map Figure for NH4
The NH4 plumes are shown with the highest magnitude in red, and analyte levels near zero are purple. The water body is shown in blue.
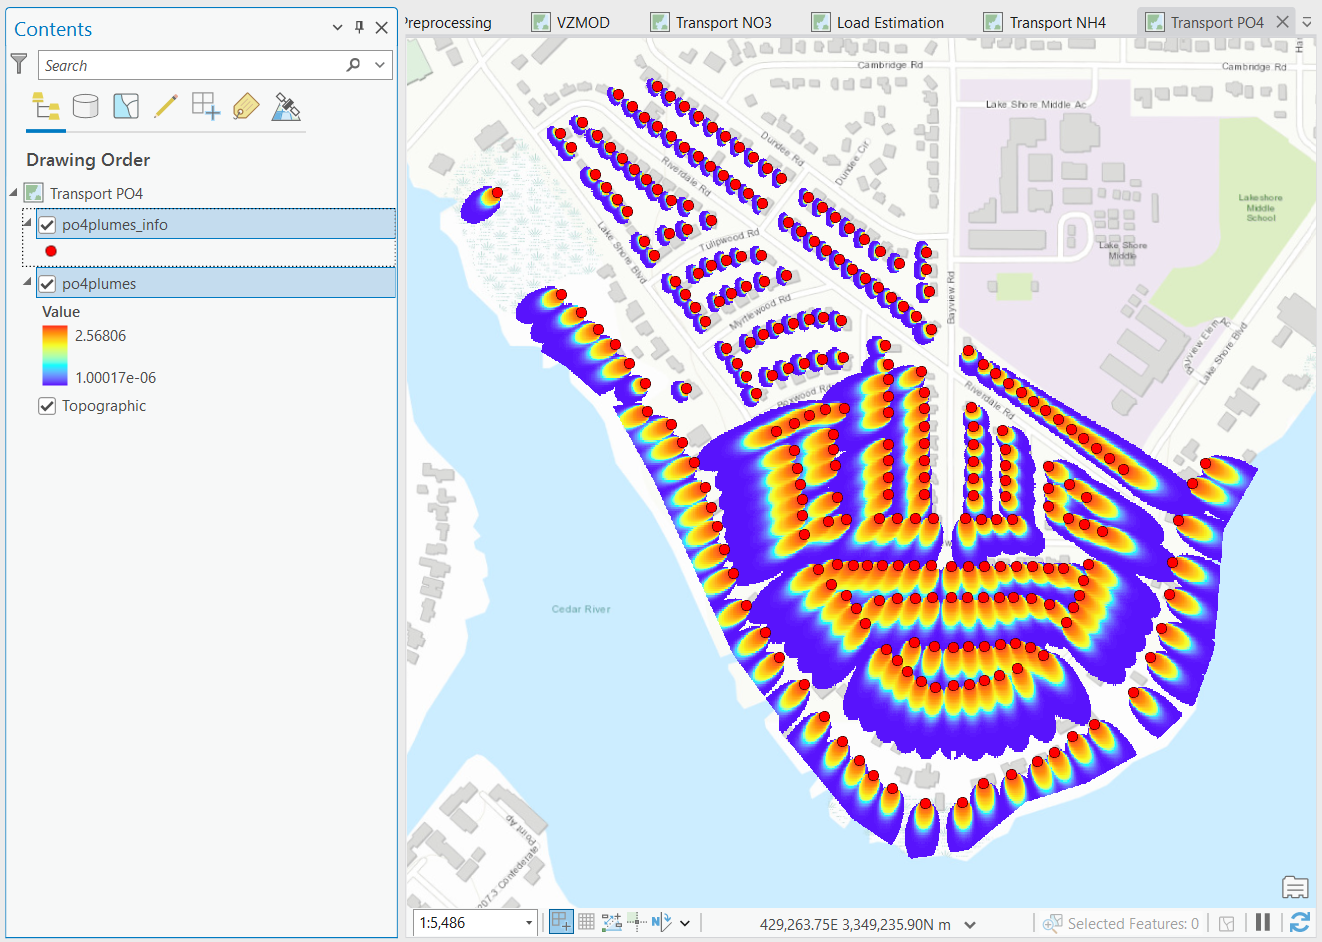
Figure 13-16: The ArcNLET-Py Transport Module outputs in the Contents Pane and Map Figure for PO4
The PO4 plumes are shown with the highest magnitude in red, and analyte levels near zero are purple. The water body is shown in blue.